Optimizing, publishing and styling Vector data
Styling with CSS
The CSS extension module allows to build map styles using a compact, expressive styling language already well known to most web developers: Cascading Style Sheets.
The extension is available on GeoServer only. The standard CSS language has been extended to allow for map filtering and managing all the details of a map production. In this section we’ll experience creating a few simple styles with the CSS language.
Styling vector data
Creating line styles
Go to the
mainrdlayer details page and click onEditing Tools > Style > Edit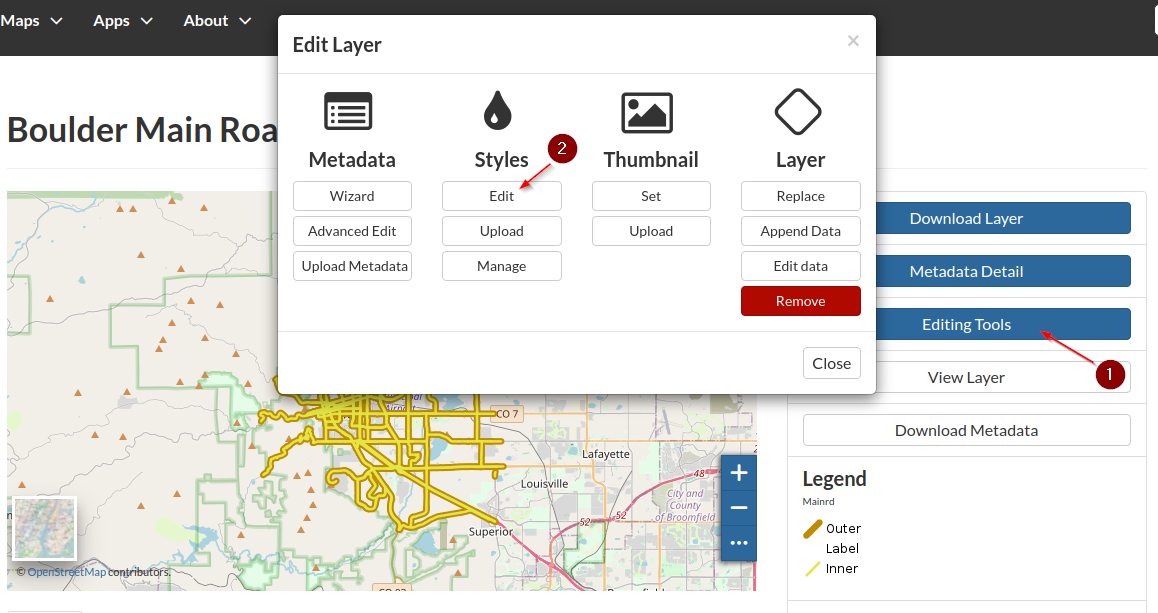
Add a new
Style; selectCSSand click on the+button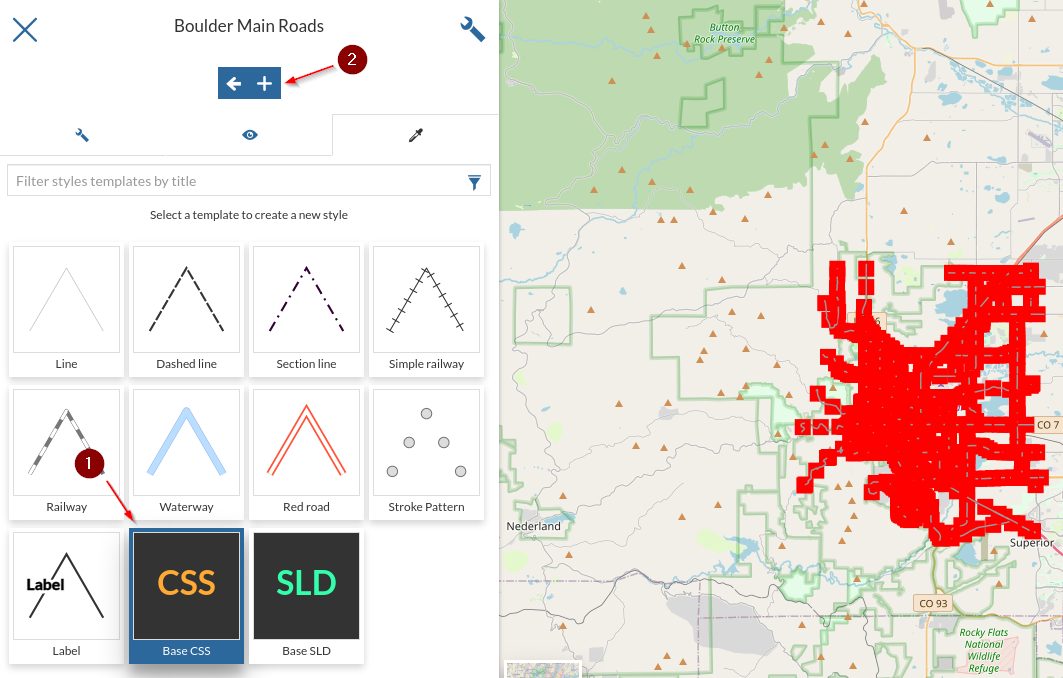
Name it
CSS RoadsandSave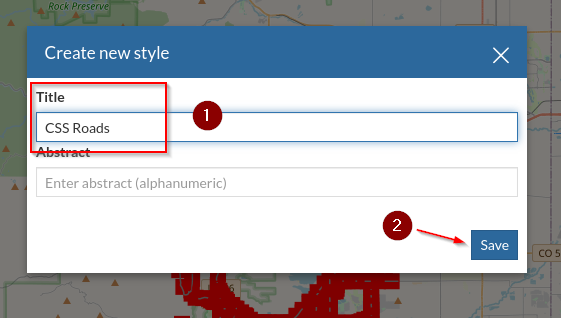
Edit the new style
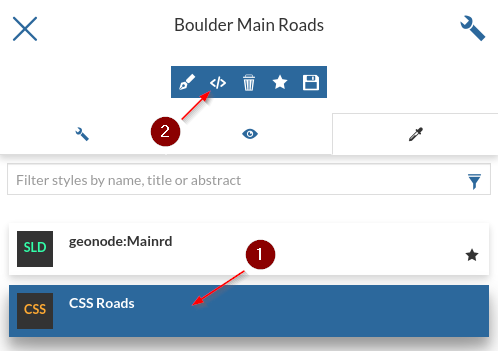
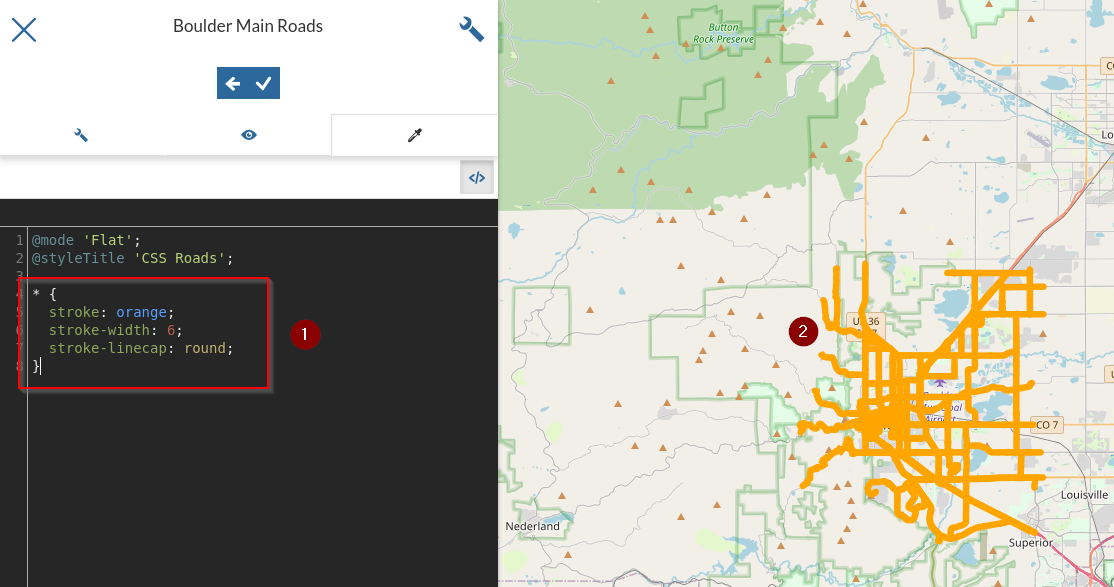
Switch to
text modeand insert the followingCSS* { stroke: orange; stroke-width: 6; stroke-linecap: round; }
Now let’s create a cased line effect by adding a second set of colours and widths, and forcing two different
z indexesfor them. Rewrite theCSSas follows* { stroke: orange, yellow; stroke-width: 6, 2; stroke-linecap: round; z-index: 1, 2; }
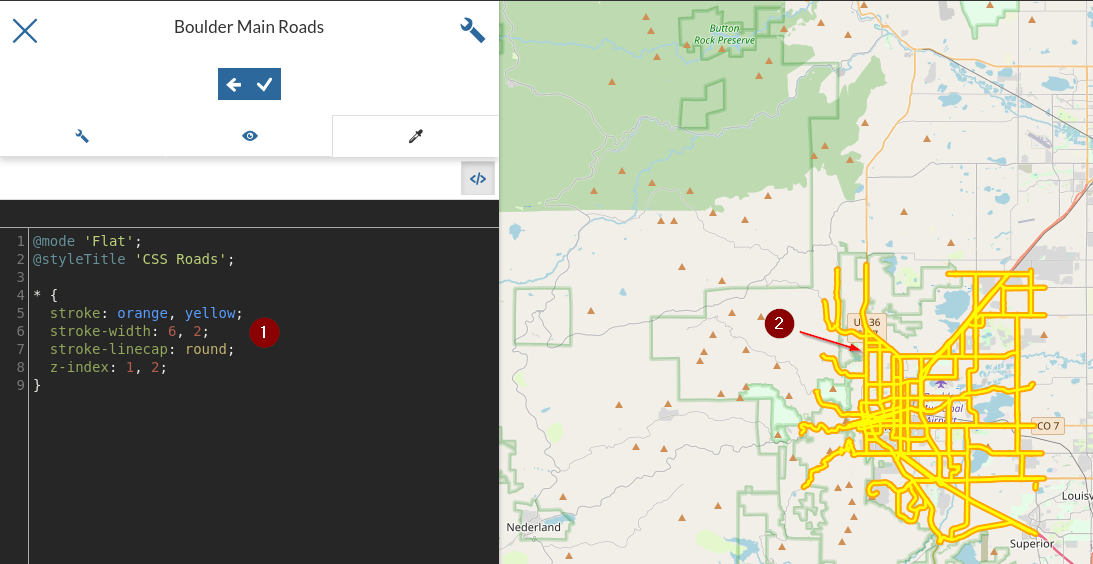
Notice the two strokes of different size look like the border of a highway.
Let’s add a label that follows the road. Rewrite the
CSSas follows* { stroke: orange, yellow; stroke-width: 6, 2; stroke-linecap: round; z-index: 1, 2; label: [LABEL_NAME]; font-fill: black; font-family: Arial; font-size: 12; font-weight: bold; halo-color: white; halo-radius: 2; -gt-label-follow-line: true; -gt-label-group: true; -gt-label-repeat: 400; -gt-label-max-displacement: 50; }
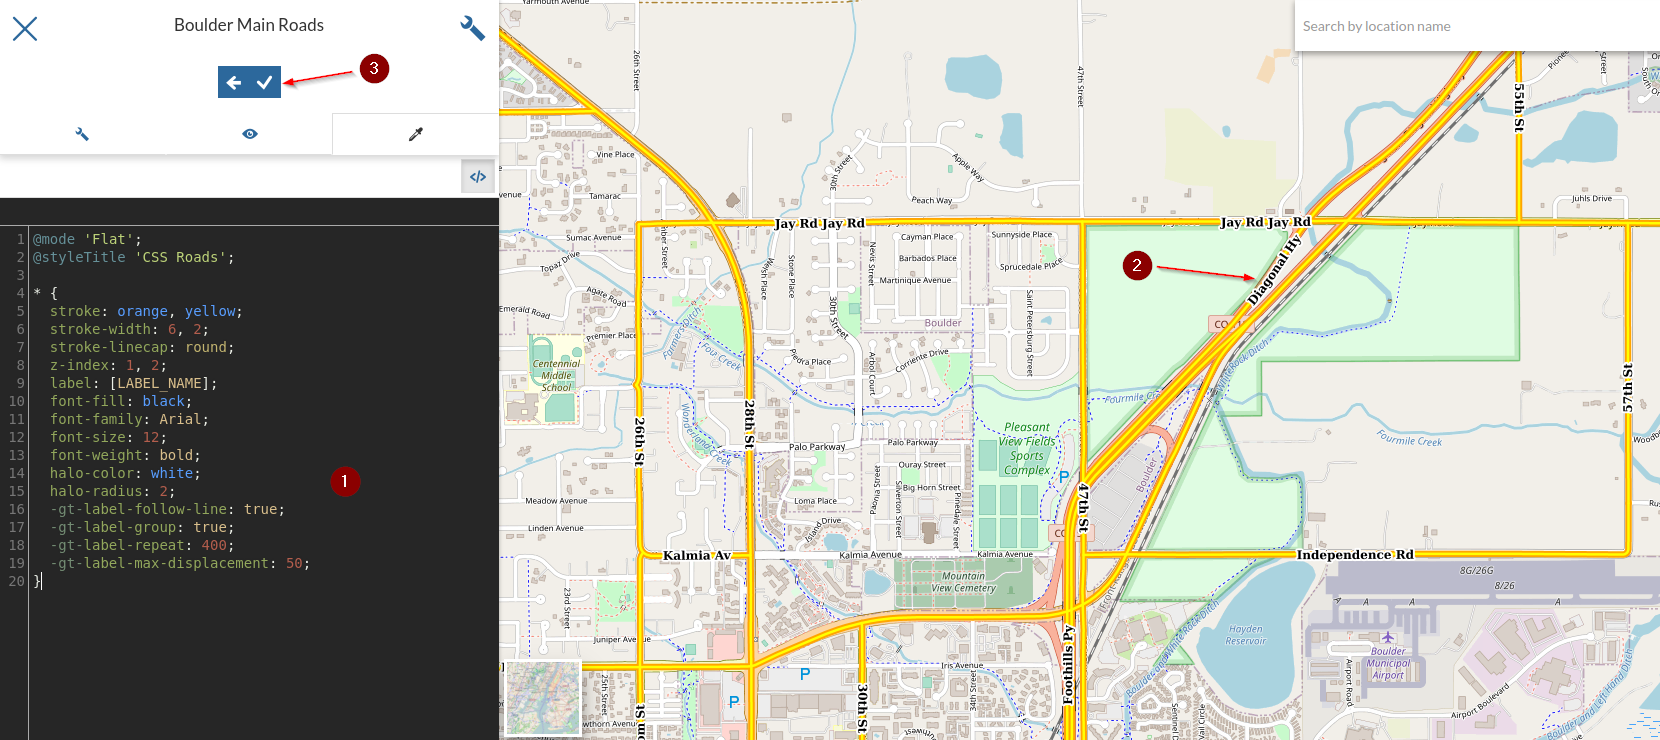
Notice how compact is the CSS syntax versus the SLD one. It is also much more intuitive. While writing the CSS the text editor is also able to hilight typeahead hints.
Creating point styles
Go to the
pointlmlayer details page and click onEditing Tools > Style > Edit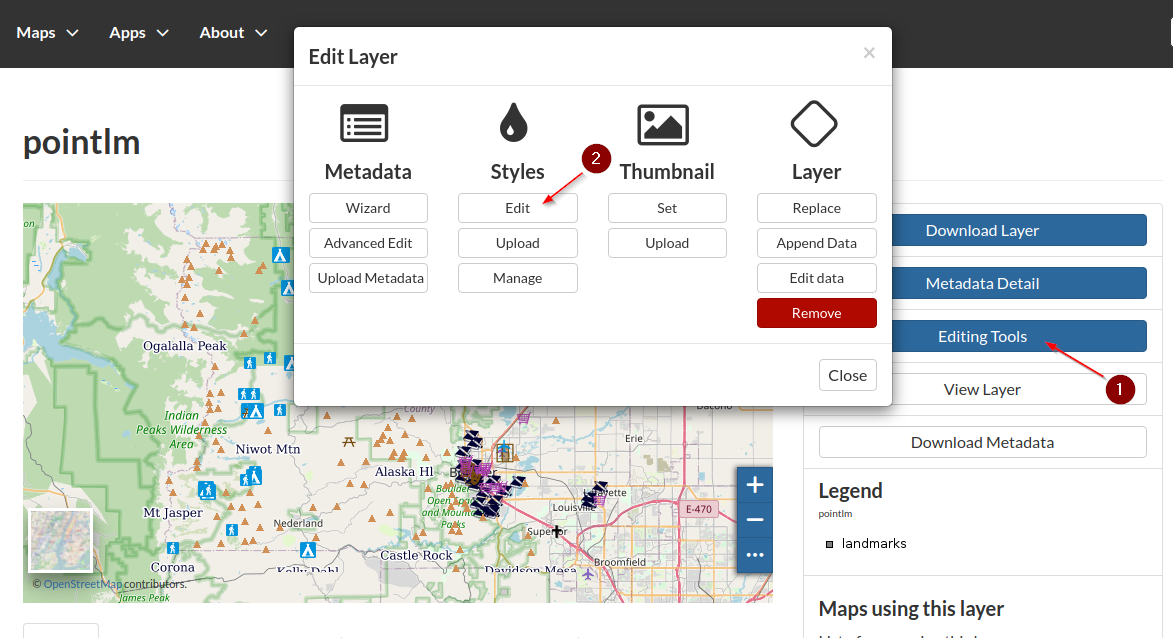
Add a new
Style; selectCSSand click on the+buttonName it
CSS LandmarksandSave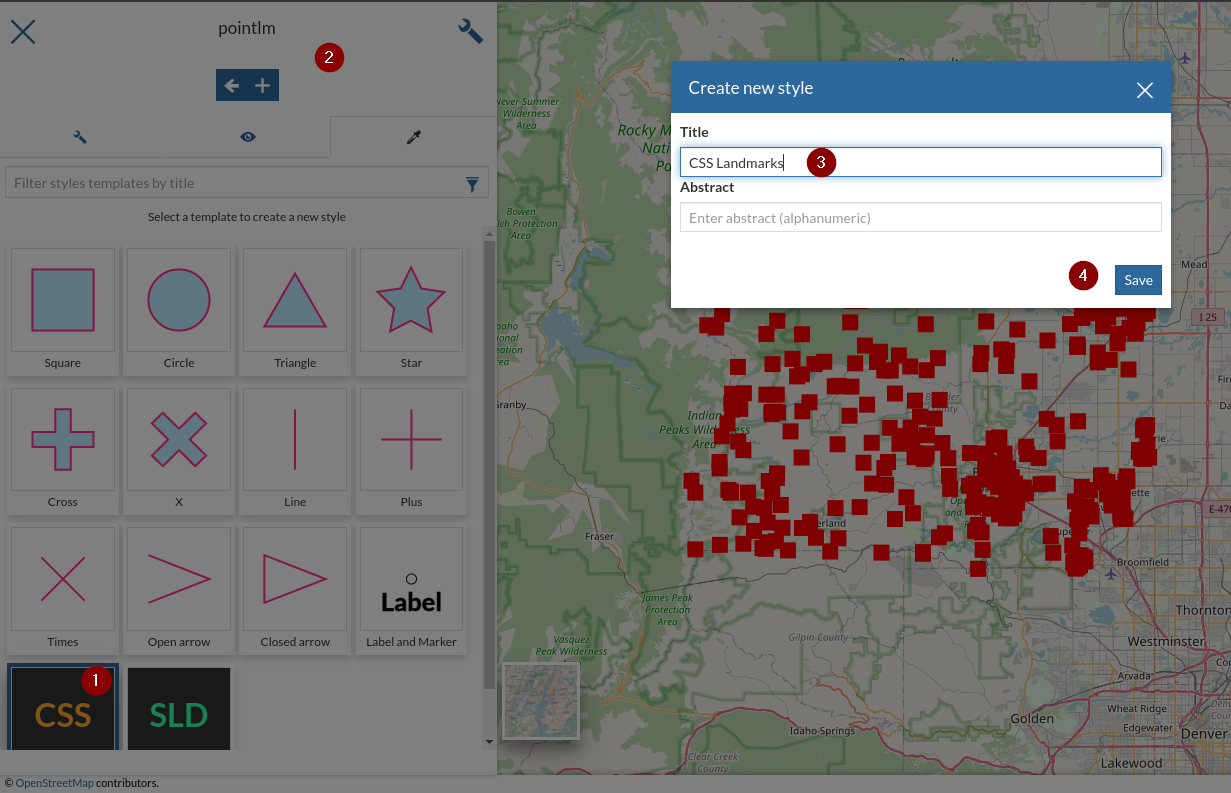
Edit the new style
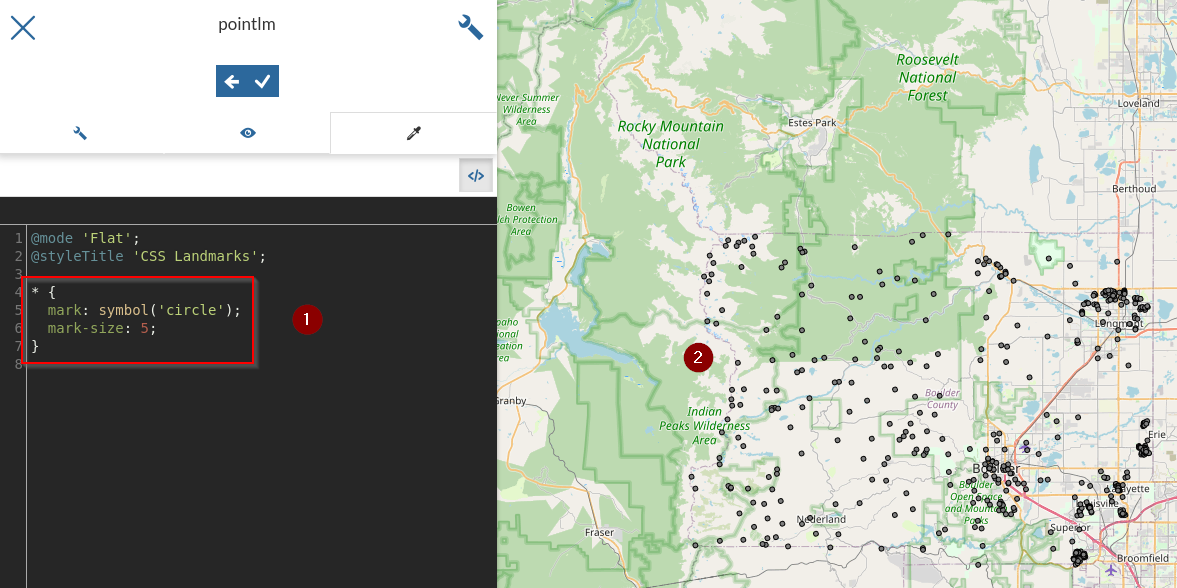
Switch to
text modeand insert the followingCSS* { mark: symbol('circle'); mark-size: 5; }
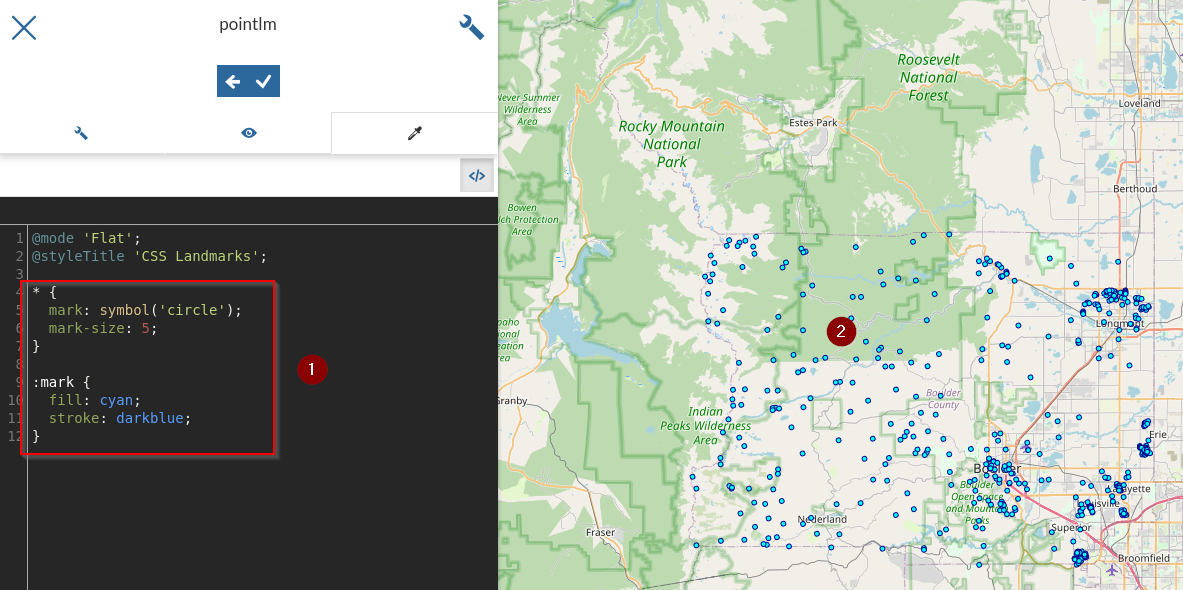
Let’s change the color of the points by specifying a
fill. If we specified afillin the top level rule it would be interpreted as a polygonal fill, to express that we want to fill inside the marks we have to create a new rule with the:markpseudo-selector* { mark: symbol('circle'); mark-size: 5; } :mark { fill: cyan; stroke: darkblue; }
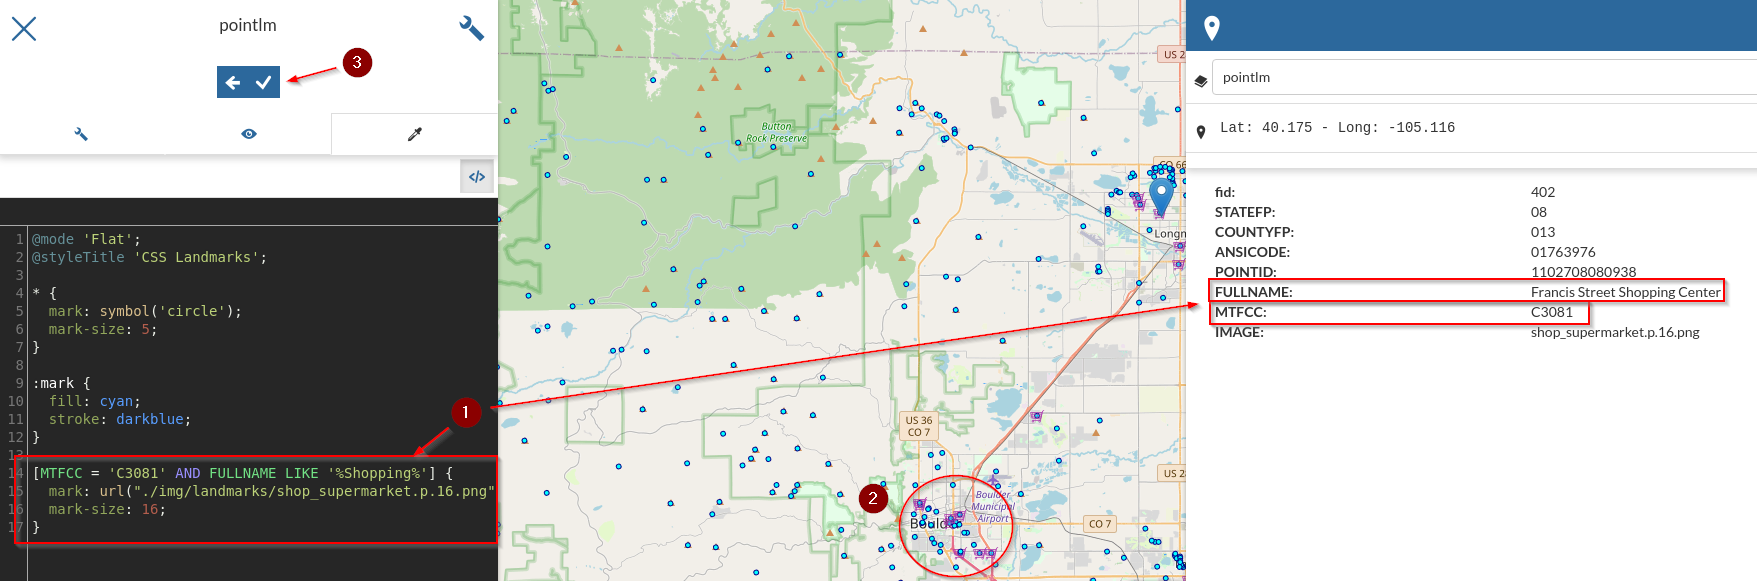
Finally, let’s override the default styling for all shopping centers. Shopping centers are not easy to find, they have a
MTFCCcategory value equal toC3081and containShoppingin the name.* { mark: symbol('circle'); mark-size: 5; } :mark { fill: cyan; stroke: darkblue; } [MTFCC = 'C3081' AND FULLNAME LIKE '%Shopping%'] { mark: url("./img/landmarks/shop_supermarket.p.16.png"); mark-size: 16; }
Creating polygon styles
As
test_user1, upload a theESRI Shapefilenamedne_50m_admin_0_countriesfrom the folder/opt/data/sample_data/user_data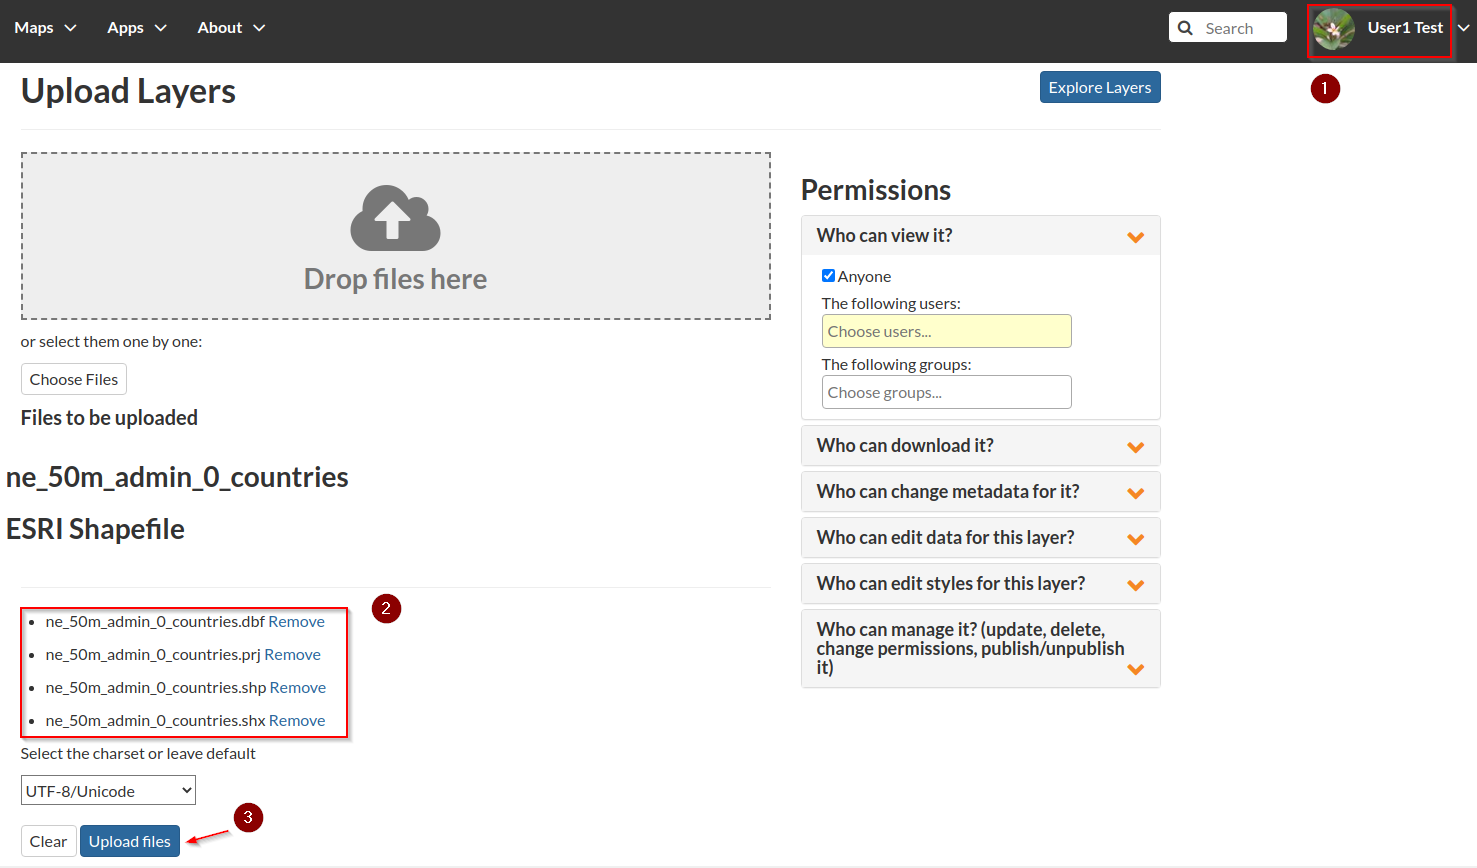
Add a new
CSSstyle to the new layer namesCSS Population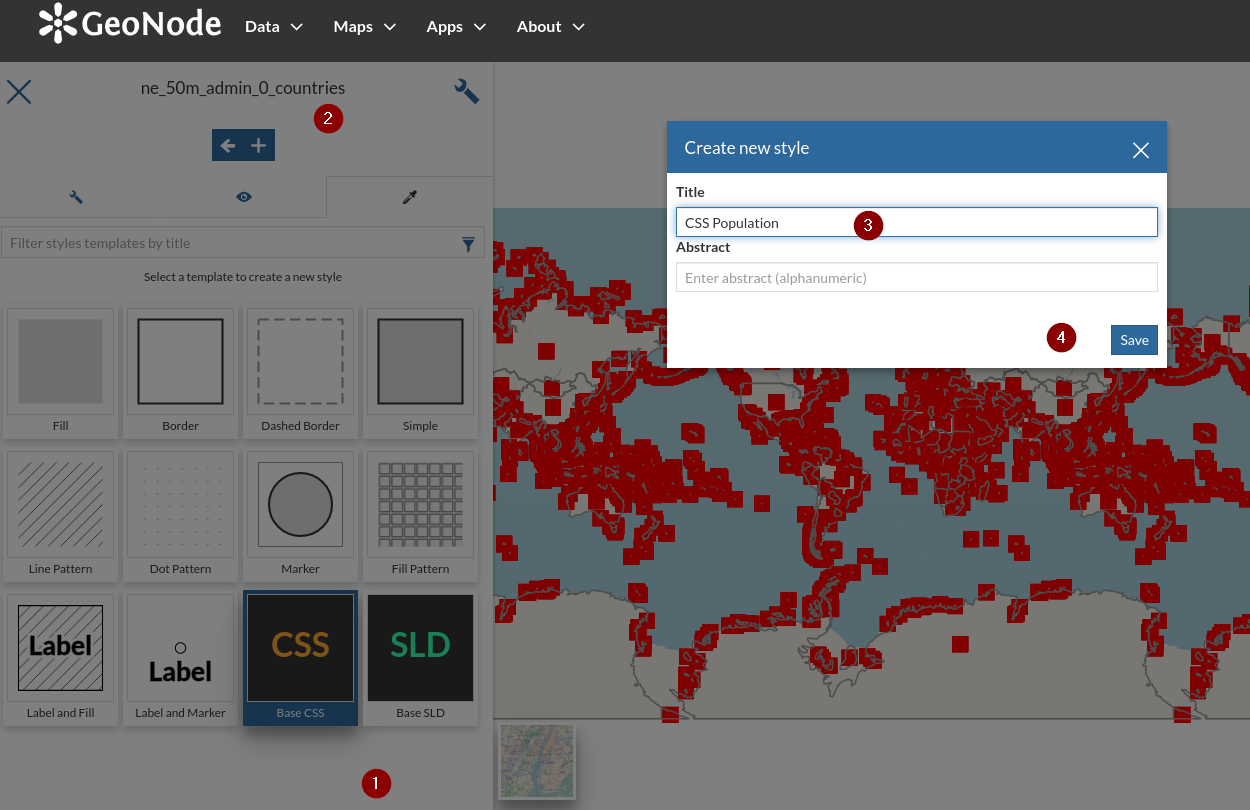
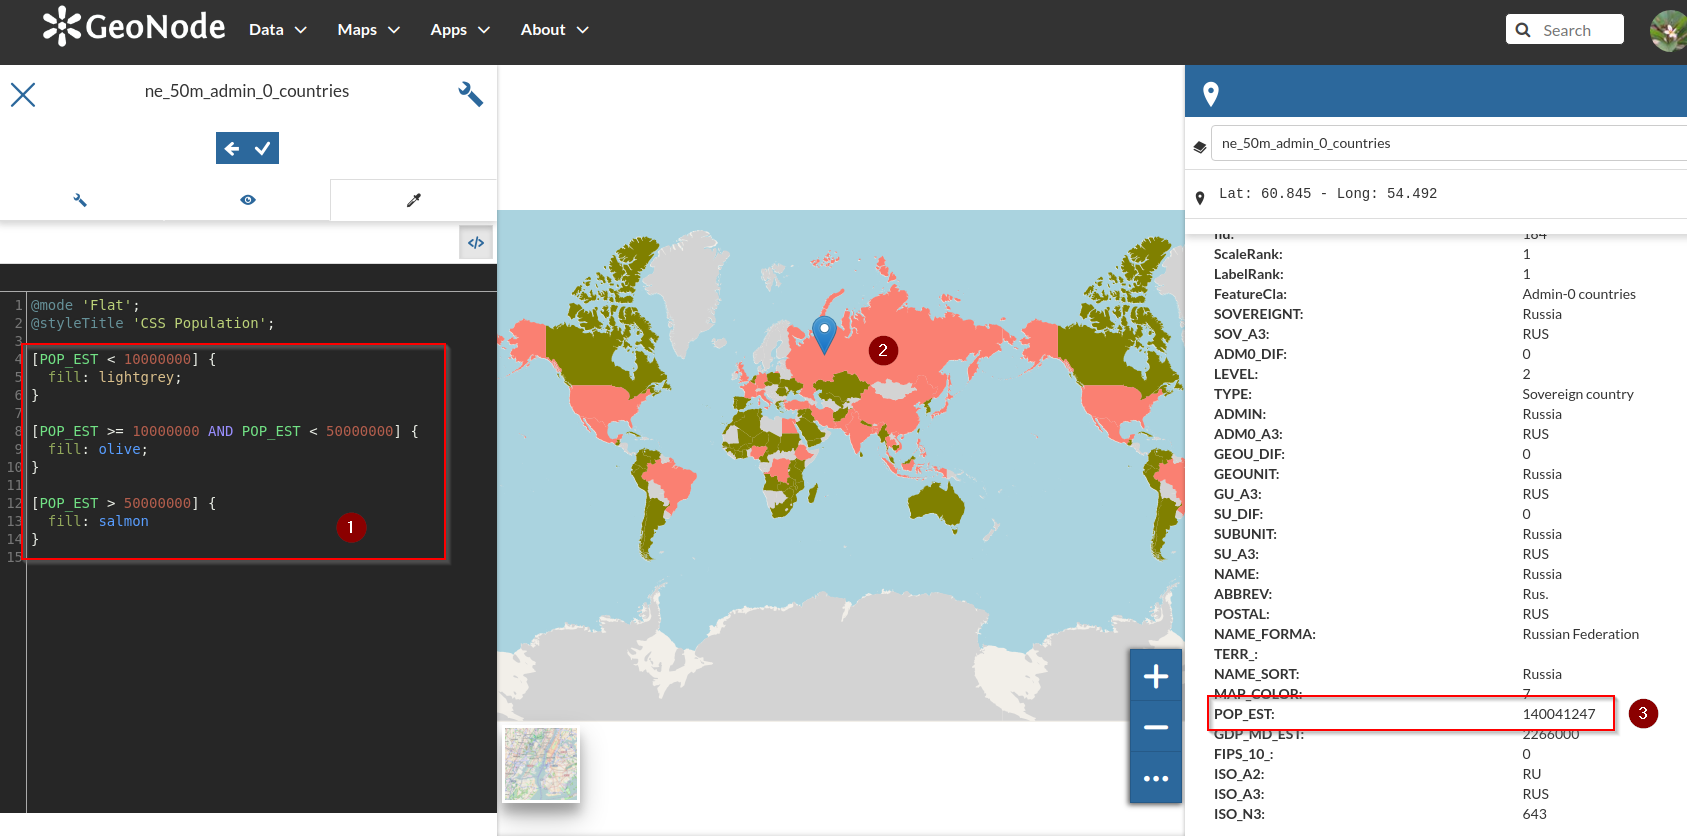
We want to create a simple 3 class thematic map based on the country population, stored in the
POP_ESTattribute[POP_EST < 10000000] { fill: lightgrey; } [POP_EST >= 10000000 AND POP_EST < 50000000] { fill: olive; } [POP_EST > 50000000] { fill: salmon }
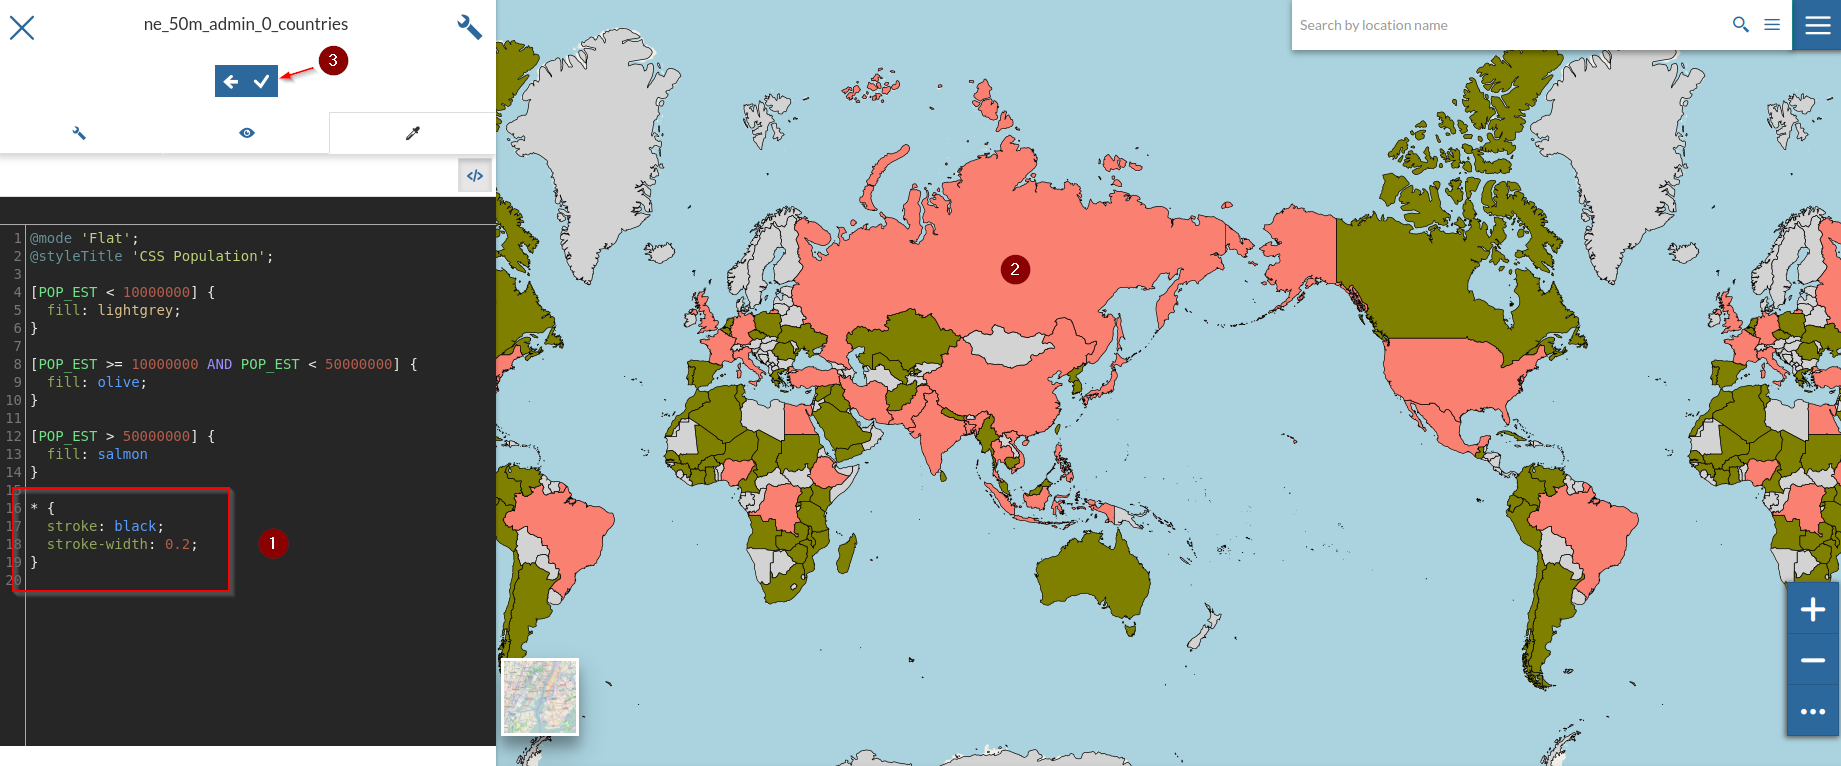
Let’s also add a very thin black border around all polygons, regardless of their population, using the
* selector[POP_EST < 10000000] { fill: lightgrey; } [POP_EST >= 10000000 AND POP_EST < 50000000] { fill: olive; } [POP_EST > 50000000] { fill: salmon } * { stroke: black; stroke-width: 0.2; }
Patterns and Hatches
Upload the
ESRI Shapefilenamedtl_2010_08013_arealmfrom the folder/opt/data/sample_data/pretty_maps/data/boulder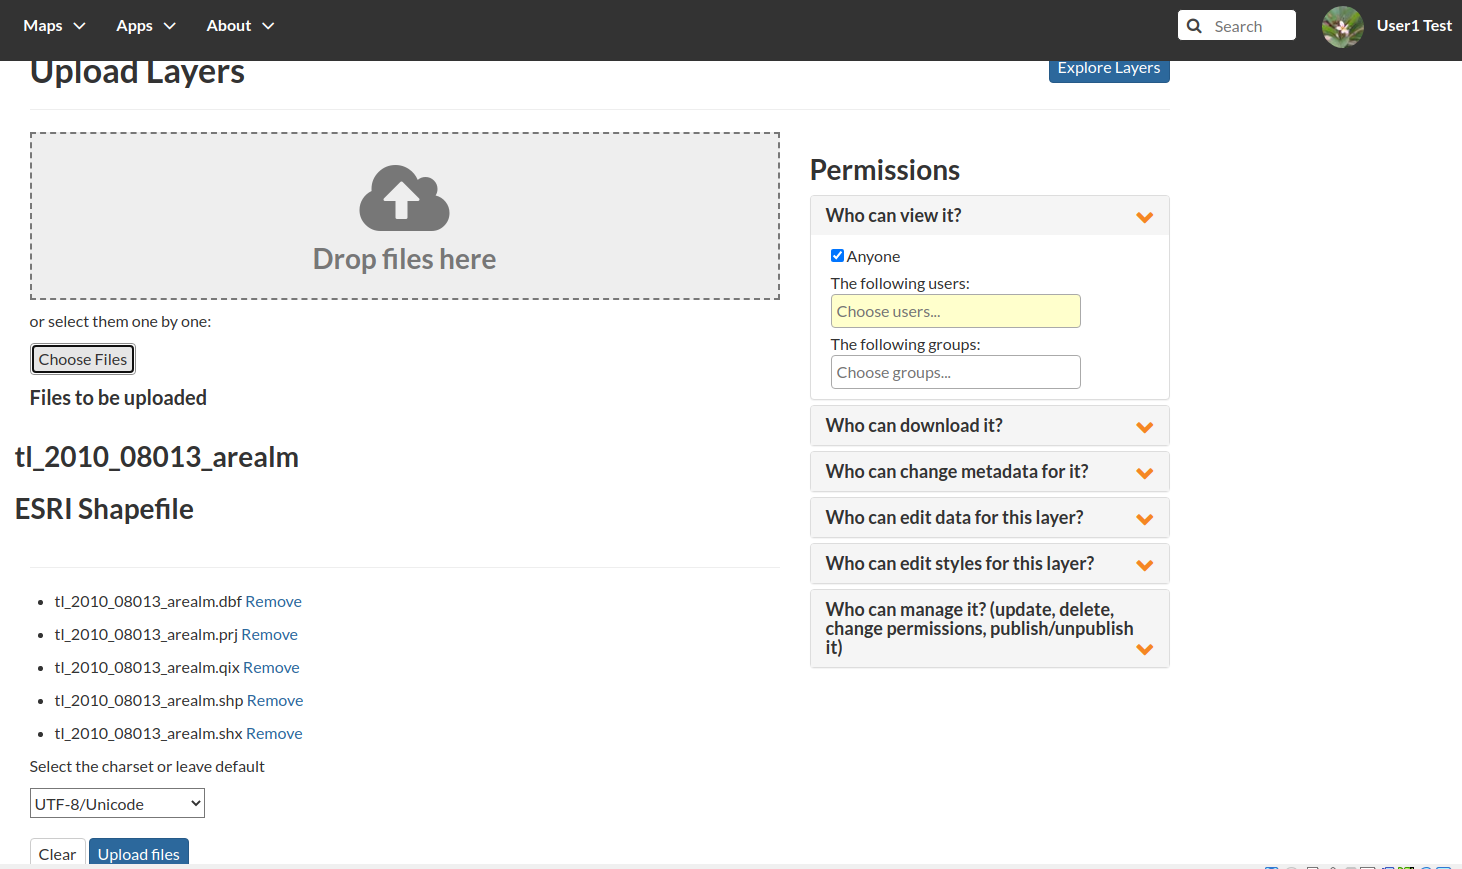
Create a new
CSSstyle namedCSS Area Landmarksfor thetl_2010_08013_arealmlayer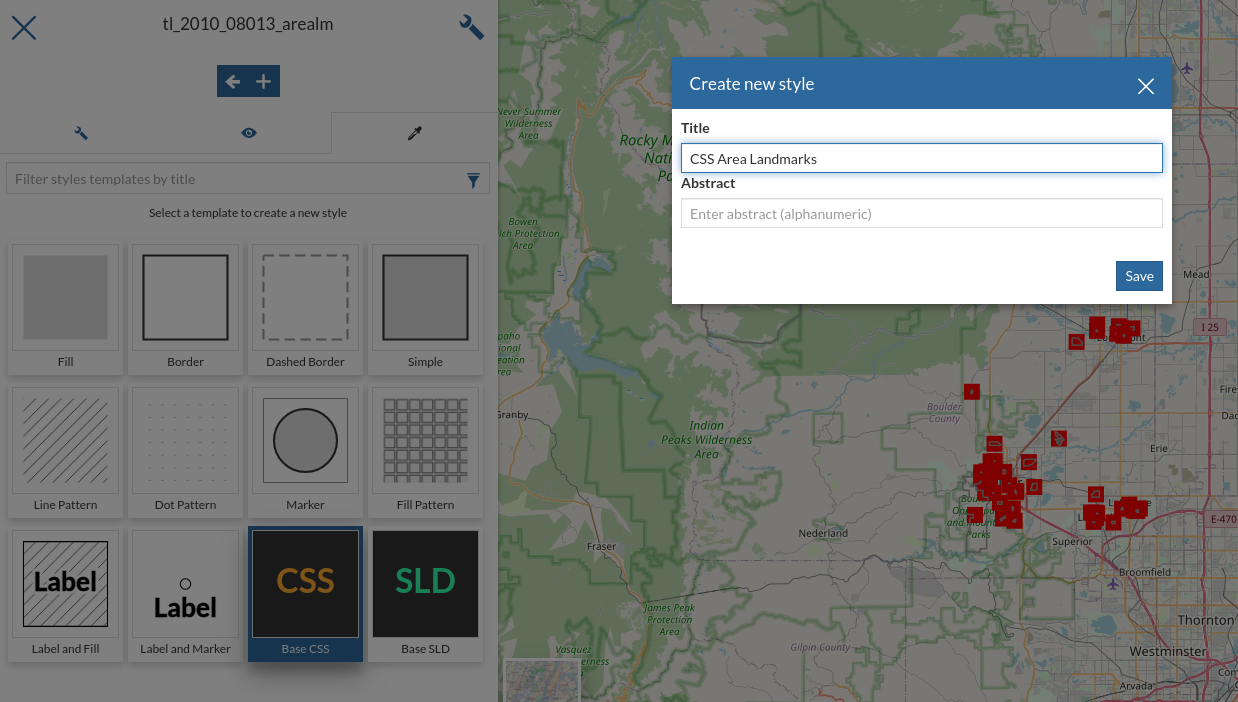
Switch to the
texteditor insert the followingCSS[MTFCC='K2582'] [@scale < 500000] { fill: url(./img/landmarks/area/grave_yard.png); fill-mime: 'image/png'; }
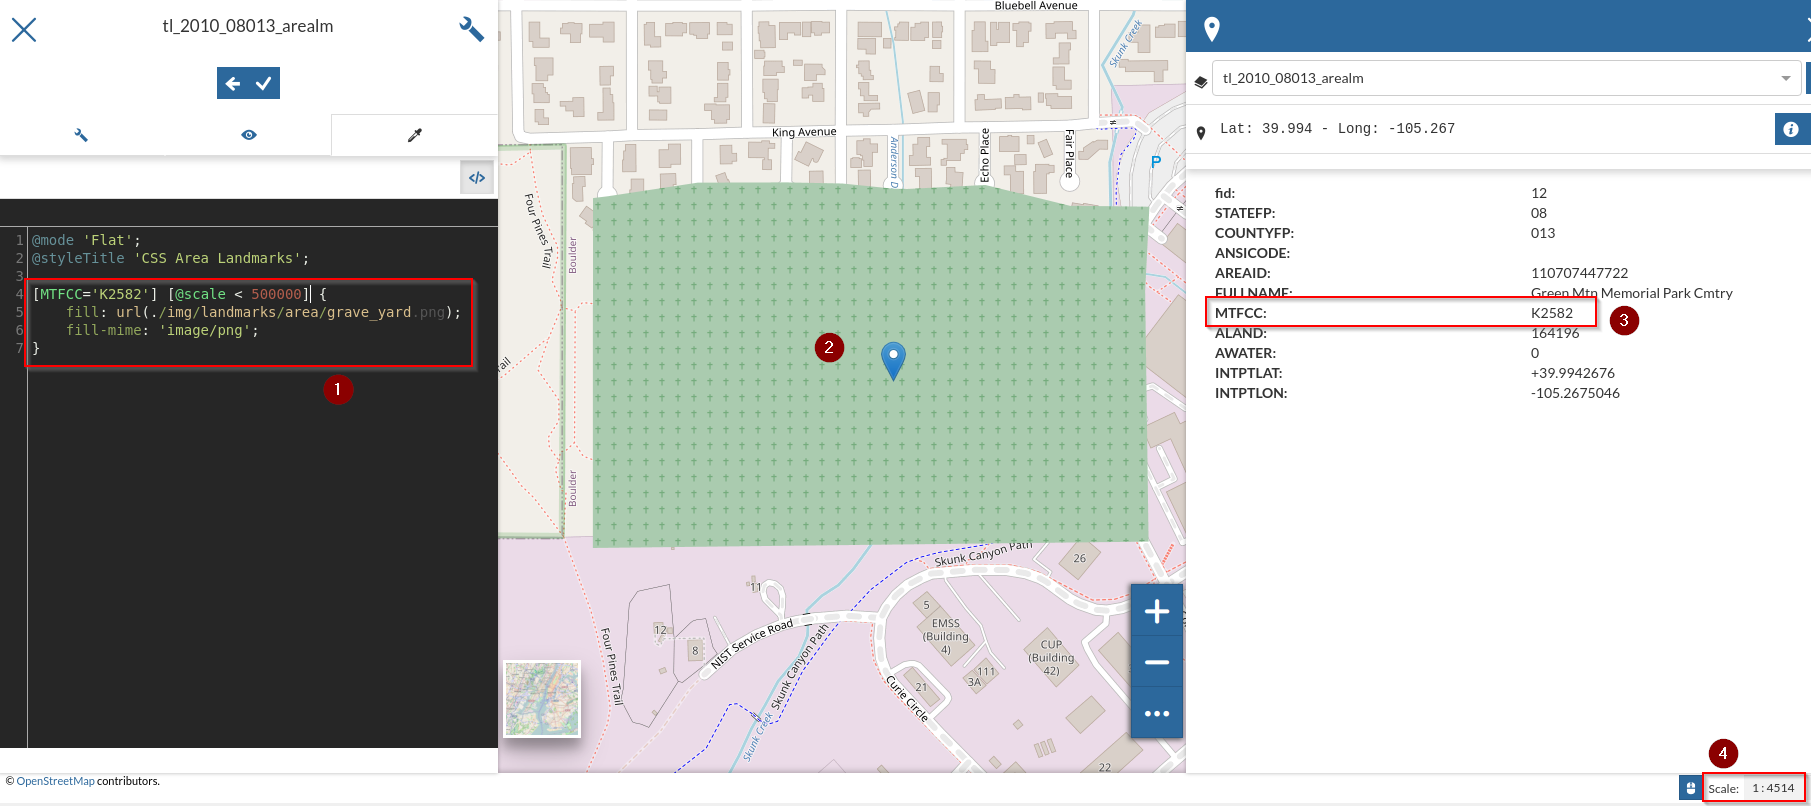
The above CSS defines a
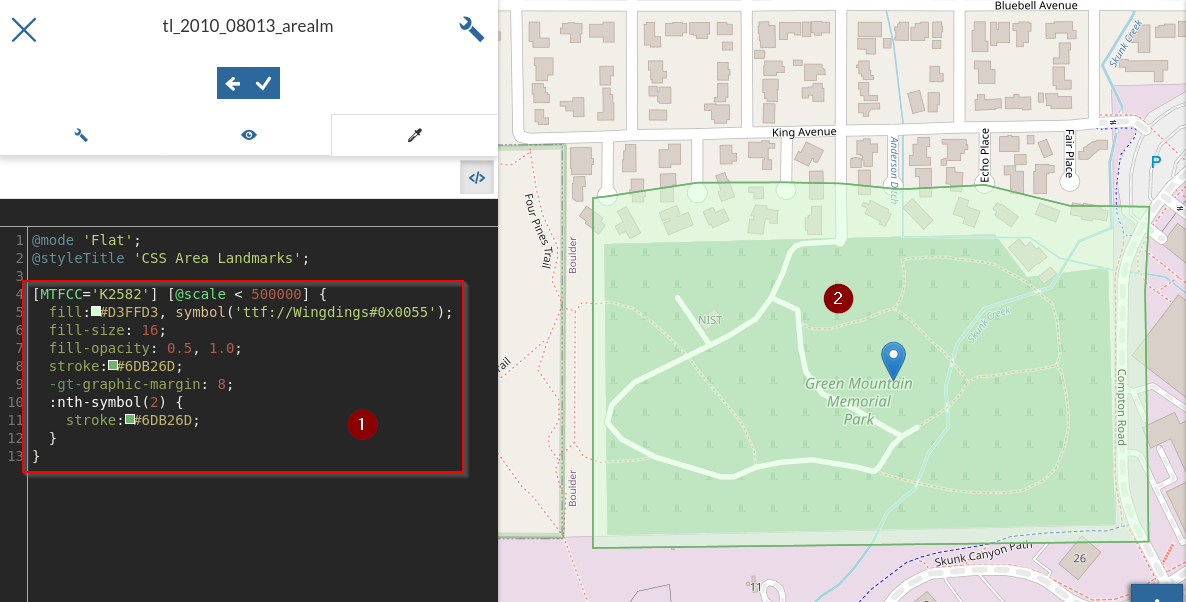
with a pointing to a png ./img/landmarks/area/grave_yard.png in the GeoServer data directory, which will be used by GeoServer as pattern to fill the polygon. The previous example uses a
pngas fill pattern; the next one uses afont characterinstead[MTFCC='K2582'] [@scale < 500000] { fill: #D3FFD3, symbol('ttf://Wingdings#0x0055'); fill-size: 16; fill-opacity: 0.5, 1.0; stroke: #6DB26D; -gt-graphic-margin: 8; :nth-symbol(2) { stroke: #6DB26D; } }
Let’s now take a look at another way to fill polygons using patterns, the
Hatches.Edit the styles of the GeoNode layer
Wetlands_regulatory_areas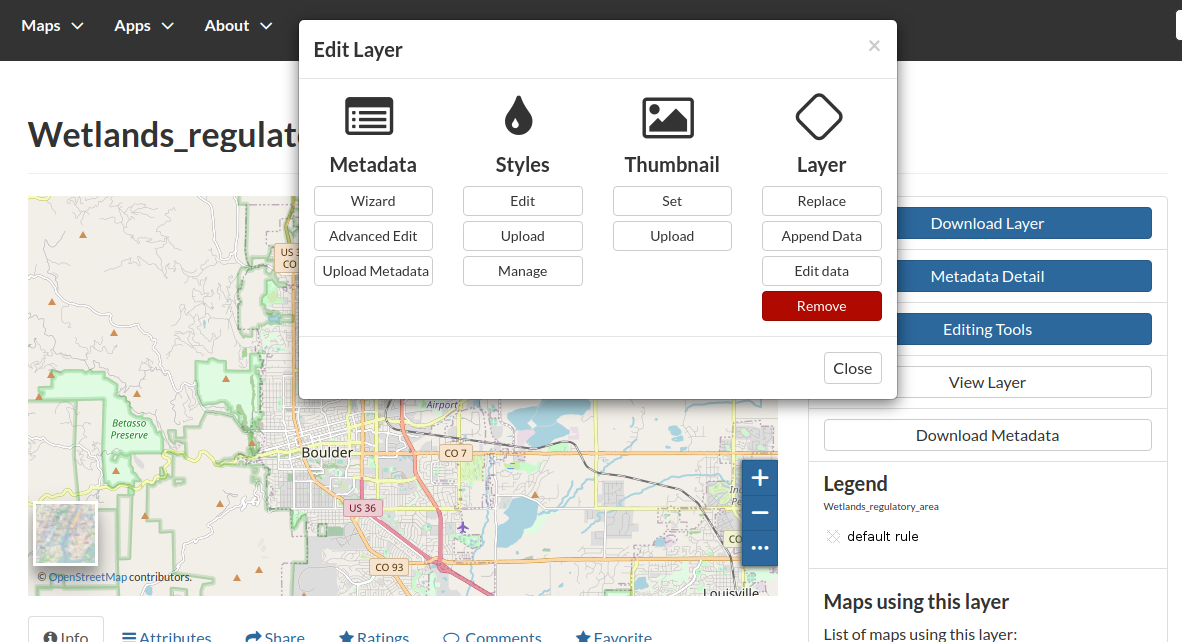
Create a new
CSSstyle and name itCSS Regulatory Area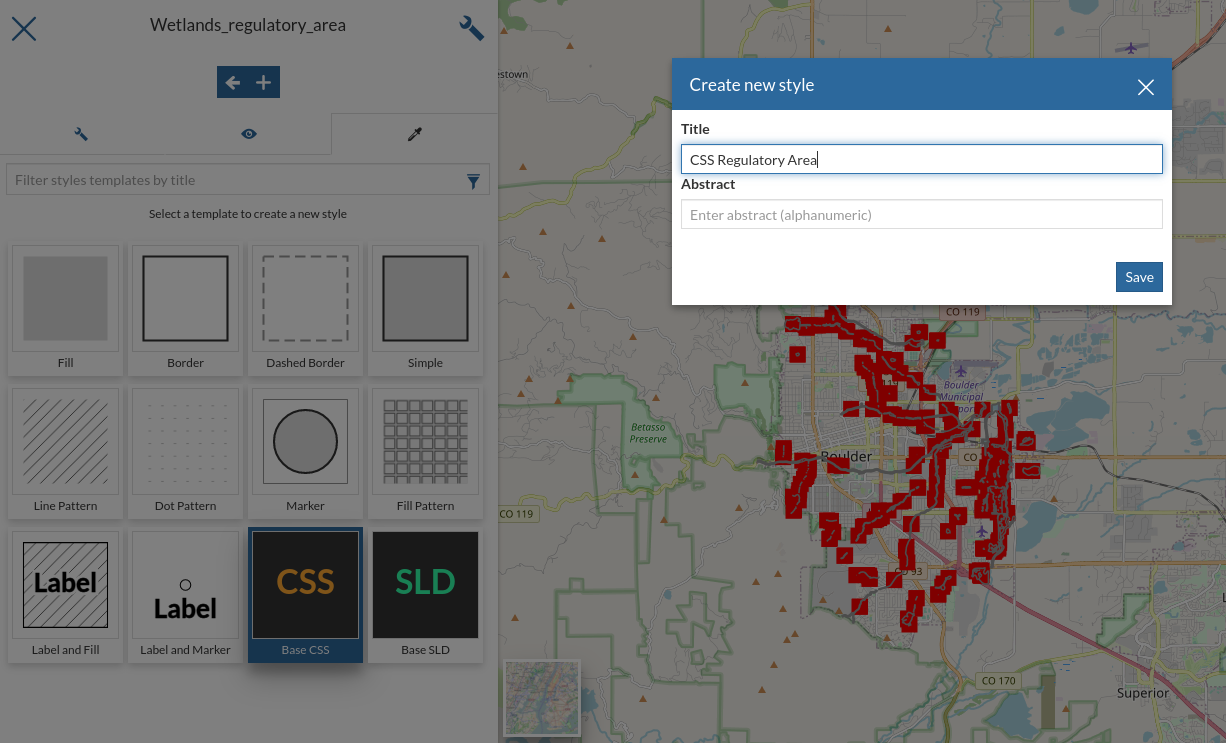
Insert the following
CSS[@scale < 10000] { fill: symbol('shape://times'); fill-size: 8; :nth-symbol(1) { stroke: #ADD8E6; stroke-width: 1.0; }; }
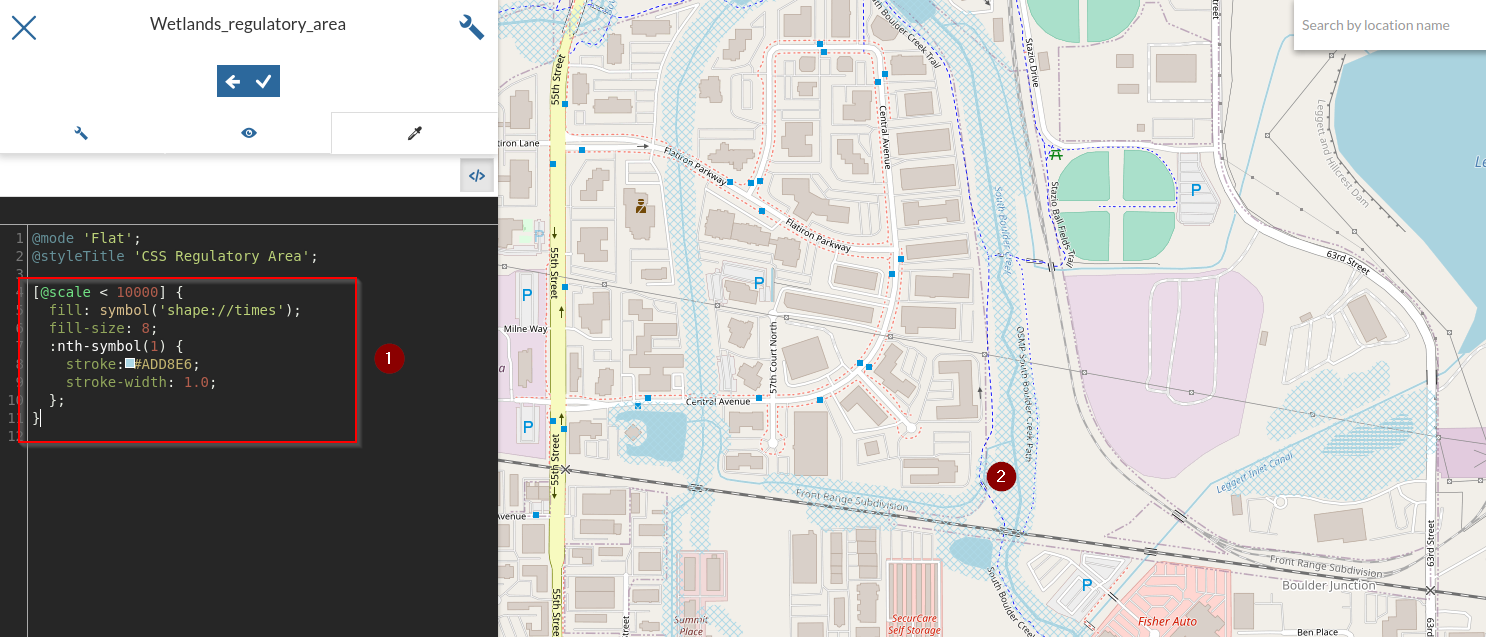
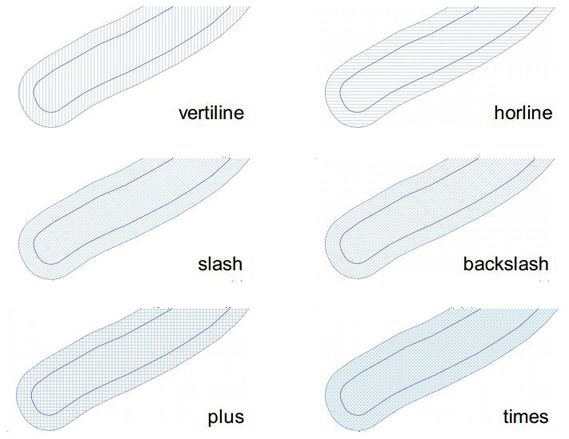
On the previous example we used times as hatches mark. GeoServer makes available different kinds of hatches marks:
Dashes
Lets now familiarize a bit with Dashes. We are going to see how it’s possible to draw several kind of dashes to represent different types of trails or roads.
Edit the styles of the GeoNode layer
Trails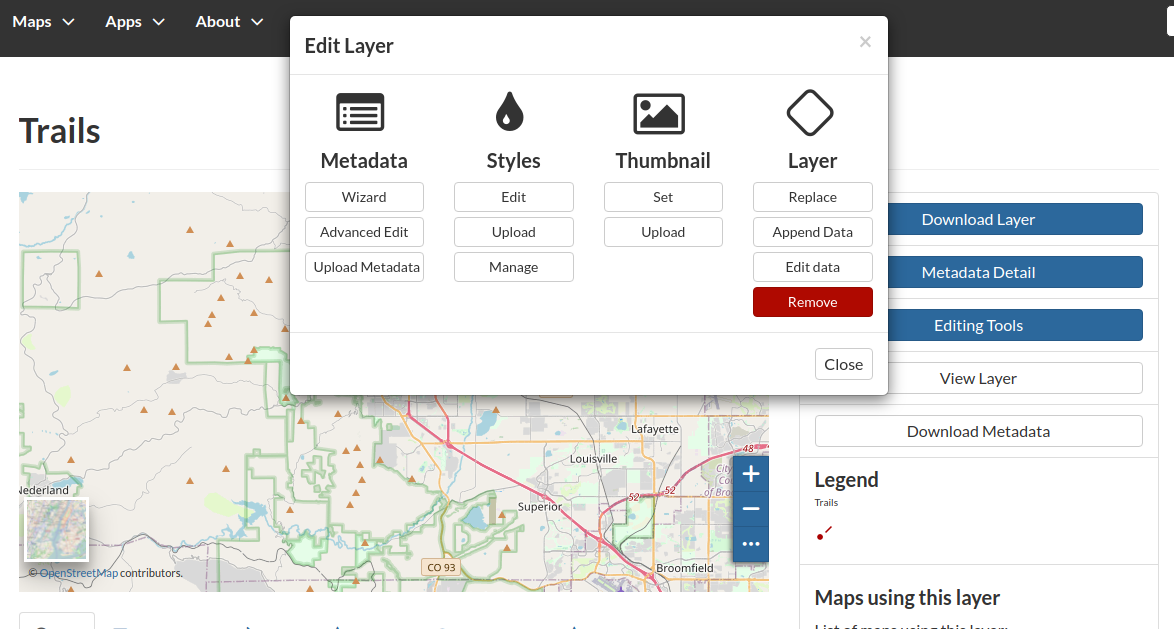
Create a new
CSSstyle and name itCSS Trails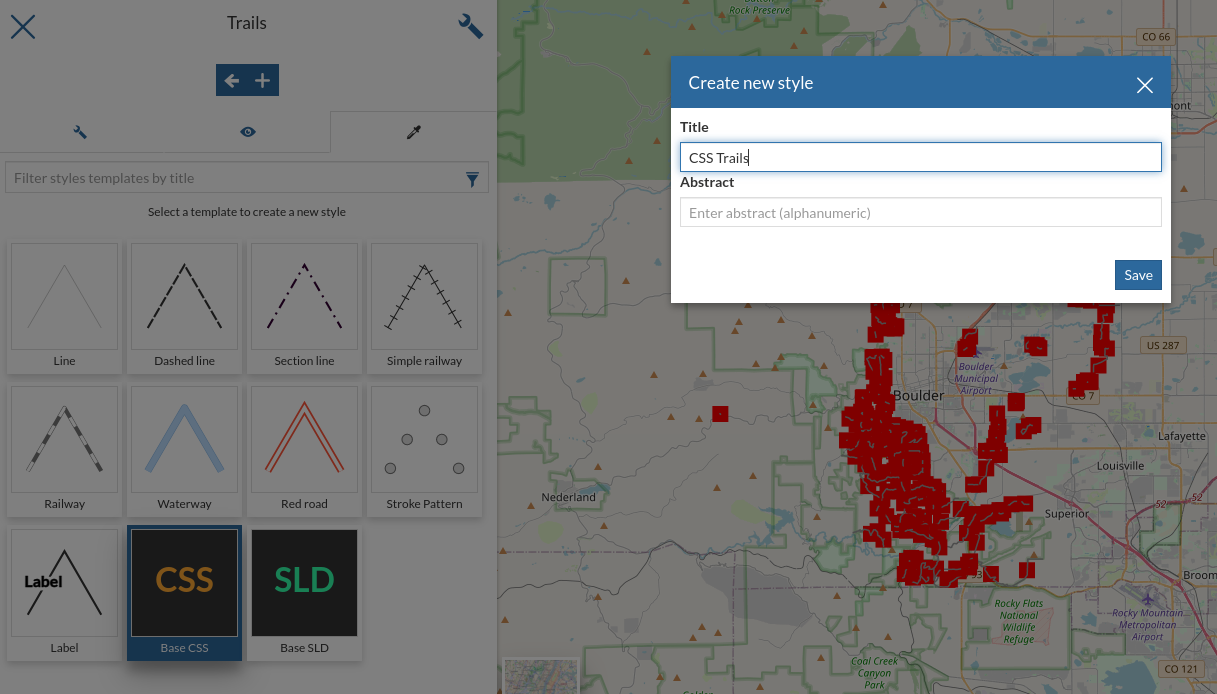
Insert the following
CSS[@scale < 75000] { stroke: #6B4900; stroke-width: 0.1; stroke-dasharray: 2.0; }
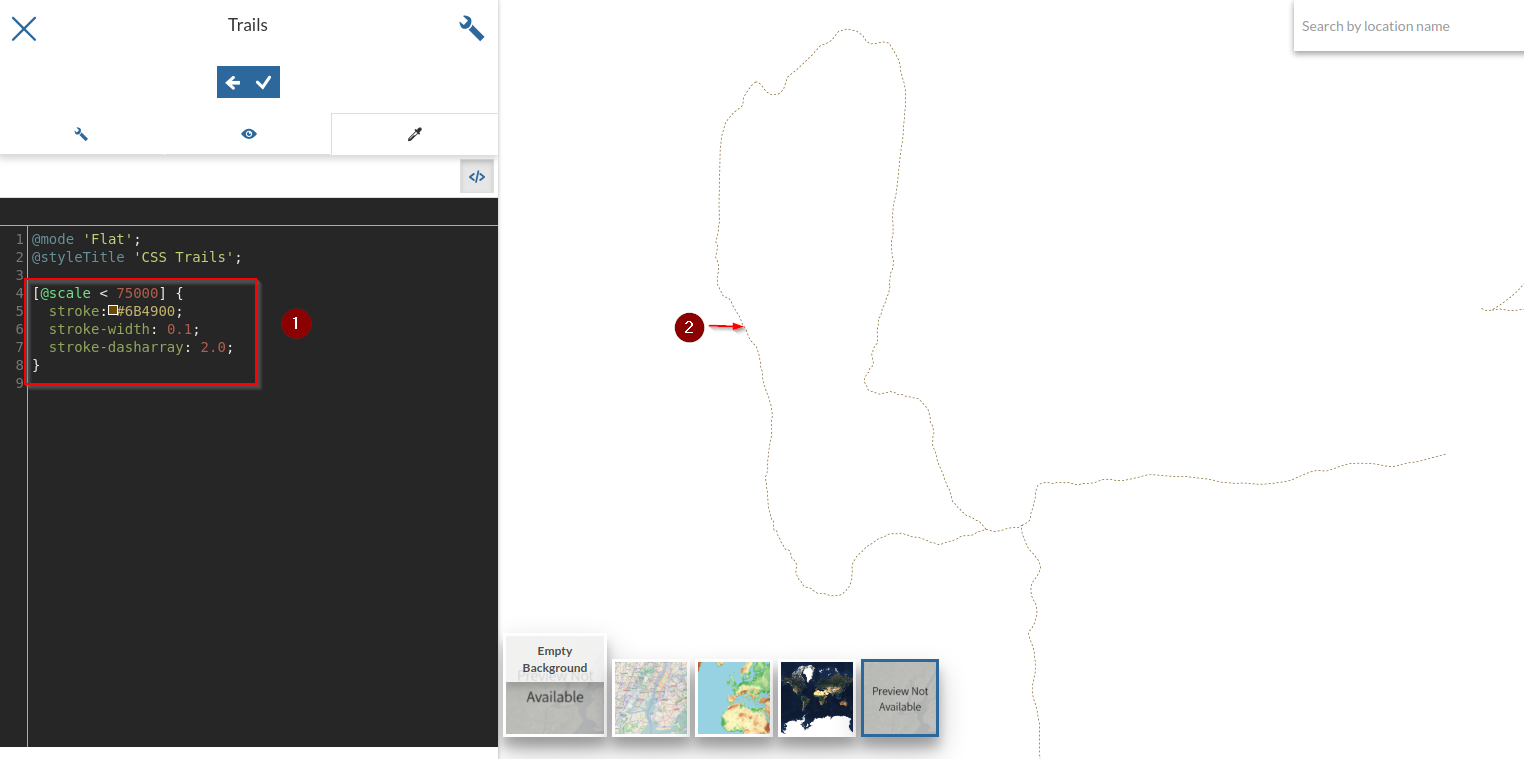
Encodes a dash pattern as a series of numbers separated by spaces. Odd-indexed numbers (first, third, etc) determine the length in pxiels to draw the line, and even-indexed numbers (second, fourth, etc) determine the length in pixels to blank out the line. Default is an unbroken line. Starting from version 2.1 dash arrays can be combined with graphic strokes to generate complex line styles with alternating symbols or a mix of lines and symbols.
Insert the following
CSS[@scale < 75000] { stroke: #AA0000, symbol(circle); stroke-dasharray: 10 14, 6 18; stroke-dashoffset: 14, 0; :nth-symbol(2) { size: 6; fill: #AA0000; } }
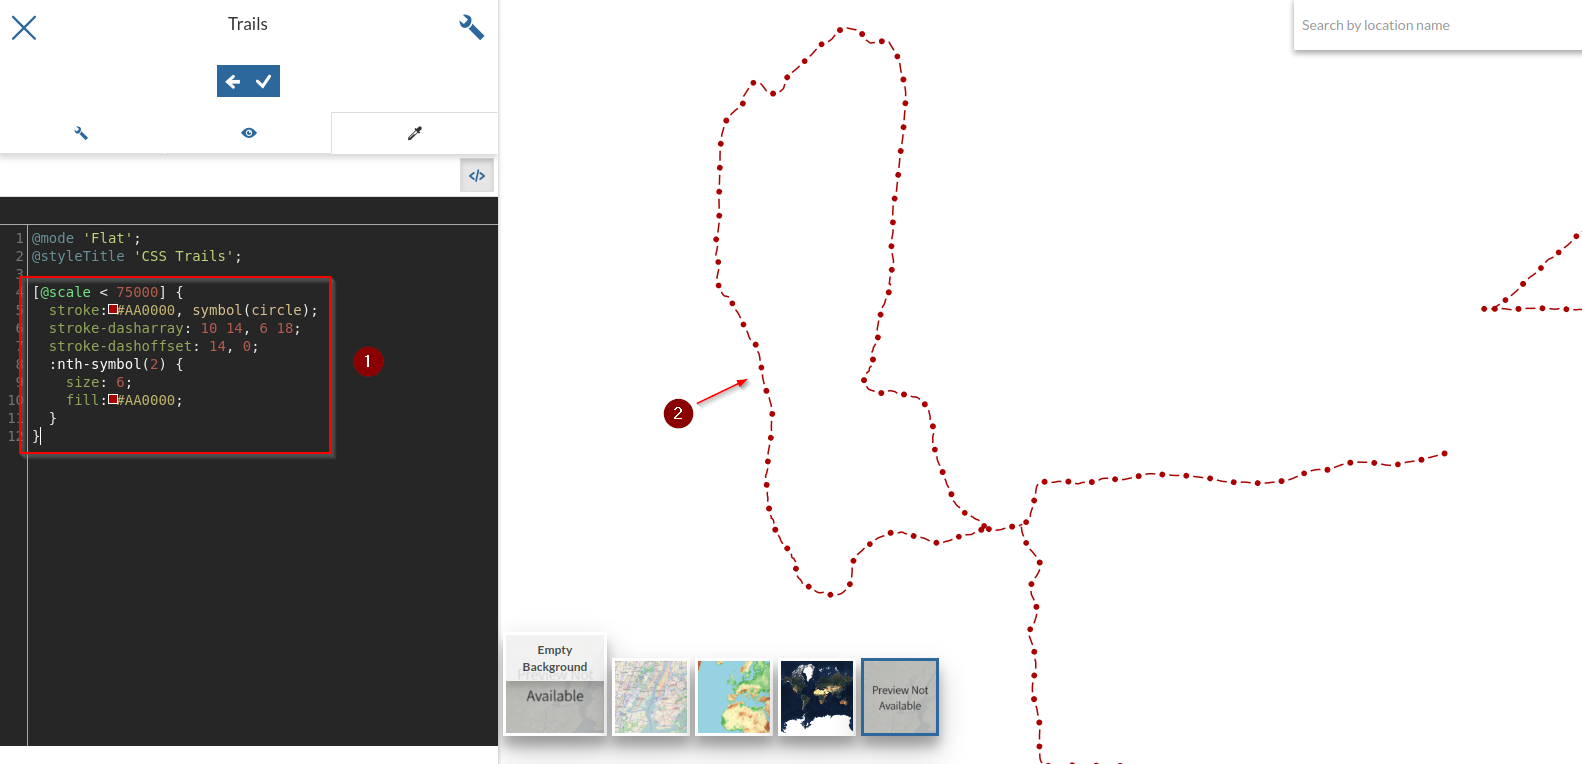
We may notice two interesting things in this style, two
<LineSymbolizer>the first one defining a circleMarkwith a simpledasharrayand the second one a simple stroke defining also adashoffset. The latter specifies the distance in pixels into the dasharray pattern at which to start drawing. Default is0.