Optimizing Maps, tips and tricks
As
test_user1edit theBouldermap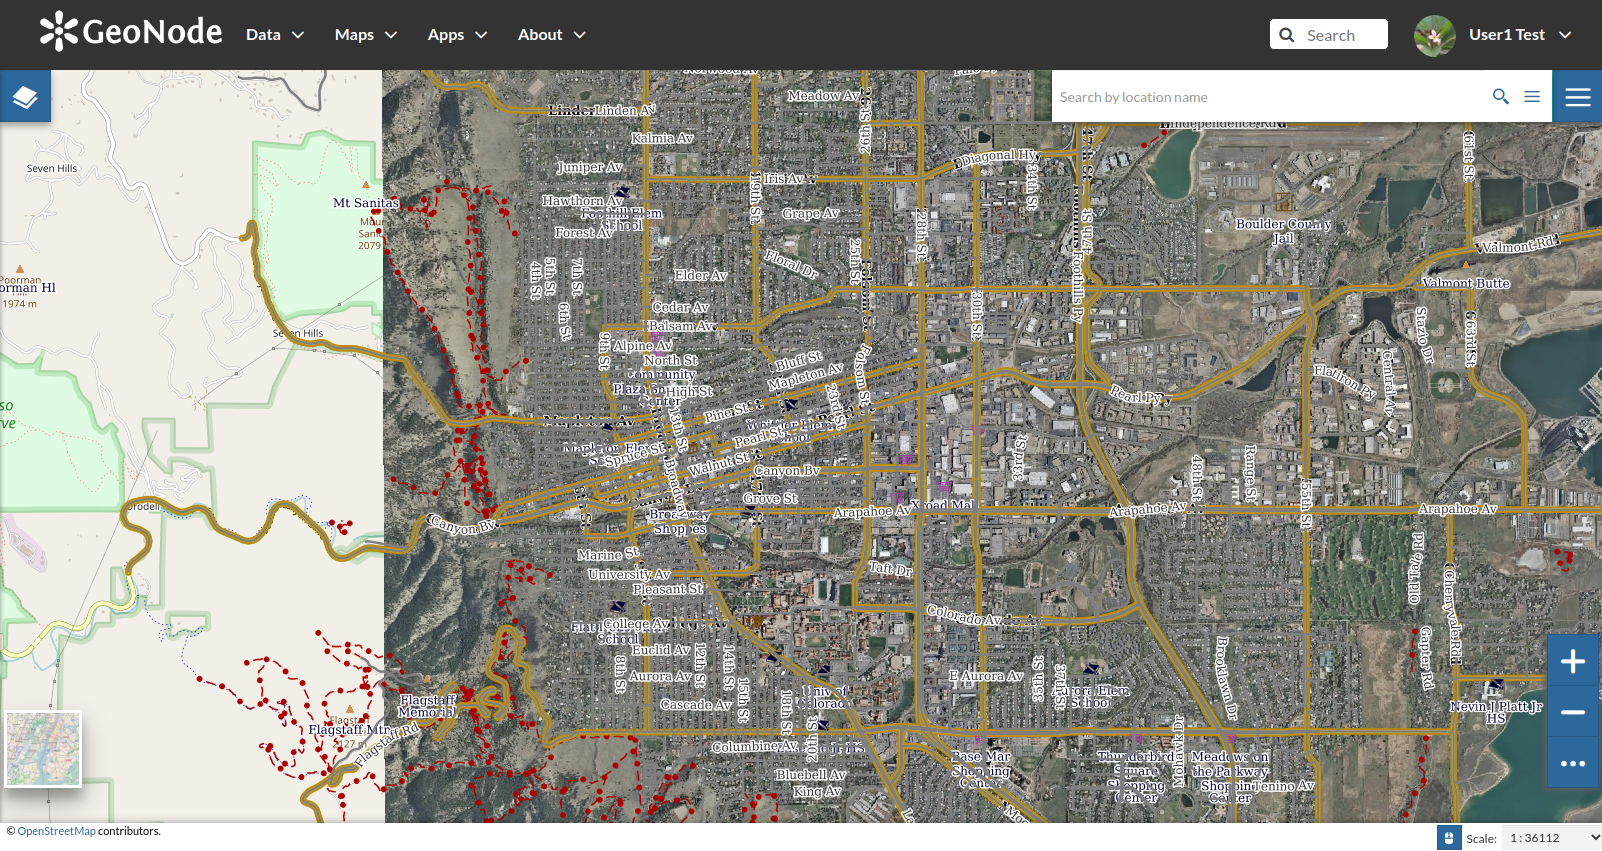
Expand the layers list and highlight the
boulder_bg_optimizedone; click on theproperty tool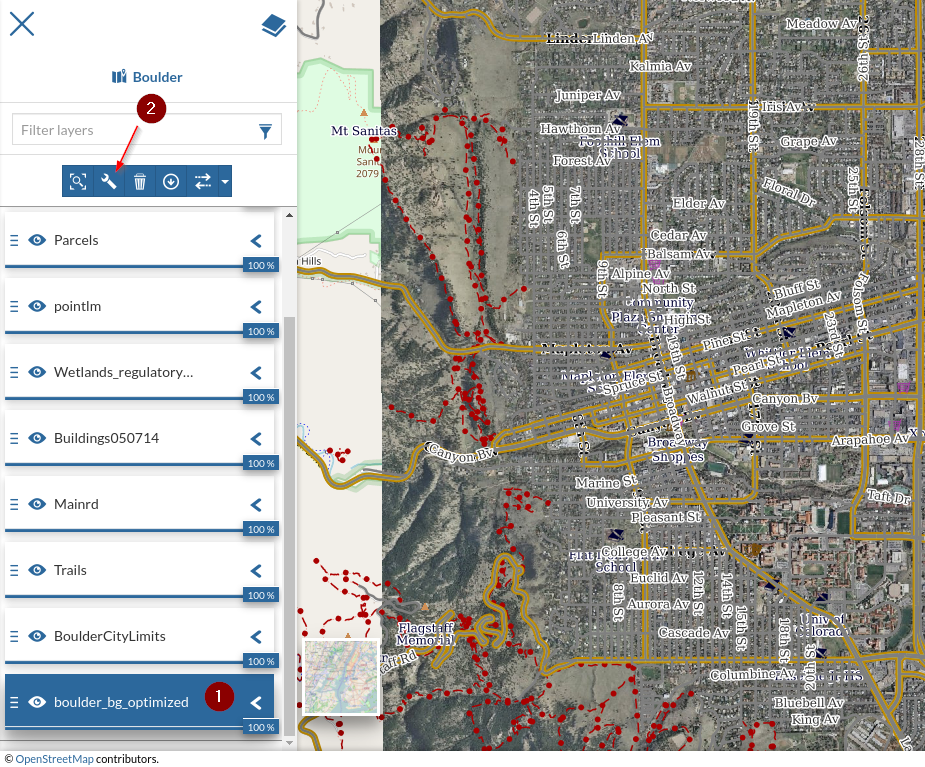
Switch to the
viewoptions tab; you will notice few settings that can be tweaked on each layer in order to improve the map quality or speedFormat: Allows us to set the output media type from the ones supported by the spatial service.
Tile Size: Usually this value is set to
256x256pixels; GeoNode sets them to512x512. This value allows us to get tiled requests to theTile Service. A higher size allows GeoNode to reduce the number of requests per layer.Visibility Limits: Have the same effects of the
Scale Denominatorrules on the styles. The two options are always applied independently.Transparent: When
enabled, allows the server to render thealphatransparent channel where no data is present.Use cache options: Whether or not use the tile service (
WMTS) or not (WMS).Single Tile: When
enabledGeoNode won’t create tiled requests for this layer, but a single one of the dimension of the current viewport. In some cases this might speed up the rendering by drastically reducing the number of requests. Be aware thatSingle Tilewill never use the server cache.

For this layer, let’s change the output format to
jpeg+png8and set theMin Scaleto some value in order to hide the layer at highest zoom levels.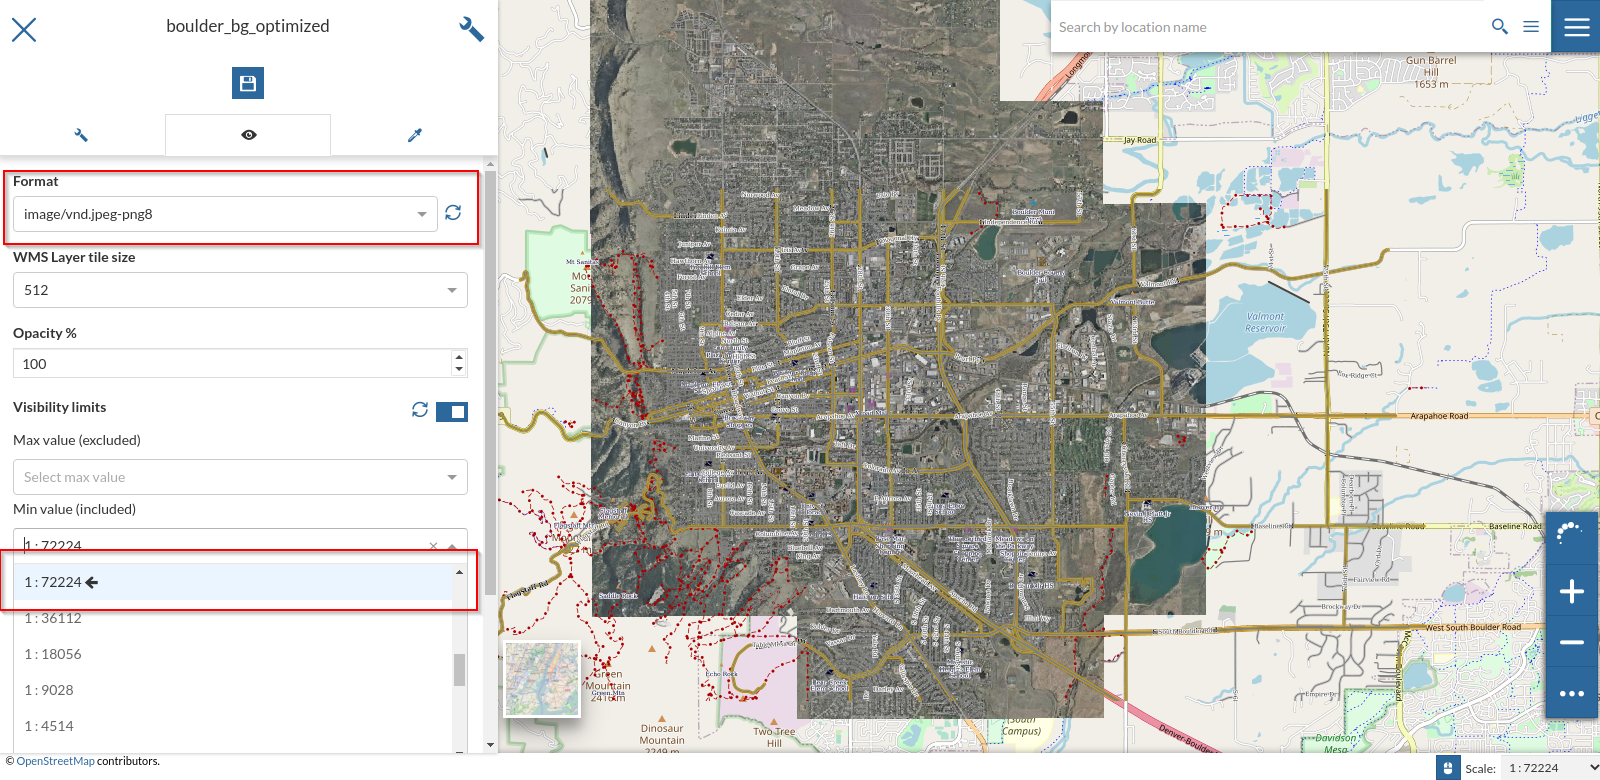
The JPEG+PNG8 output format will allow GeoServer to use JPEG compressions on images and PNG8 on transparent tiles. This will reduce the size of the images speeding up the layer, but it will also reduce its quality. That option is typically useful on raster imagery only.
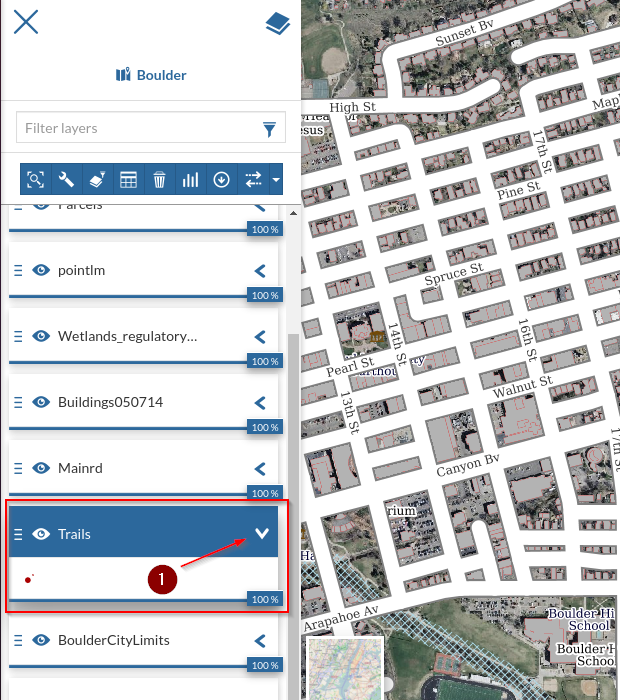
Let’s edit the options for the
Streetslayer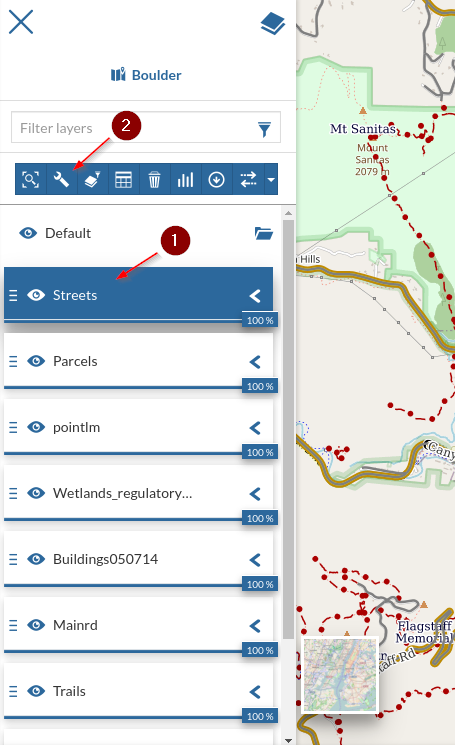
Change the output format to
PNG8; on vectorial layers with few colors, like in this case, this will reduce a lot the size of the images, resulting in an overall speed up of the layer.
Open the
Networktab of the browser and inspect theowsrequests; notice the different output format of the requests for thegeonode:Streetslayer. Do some tries by chanigng the output format and notice the difference between the sizes and timings of the outcomes.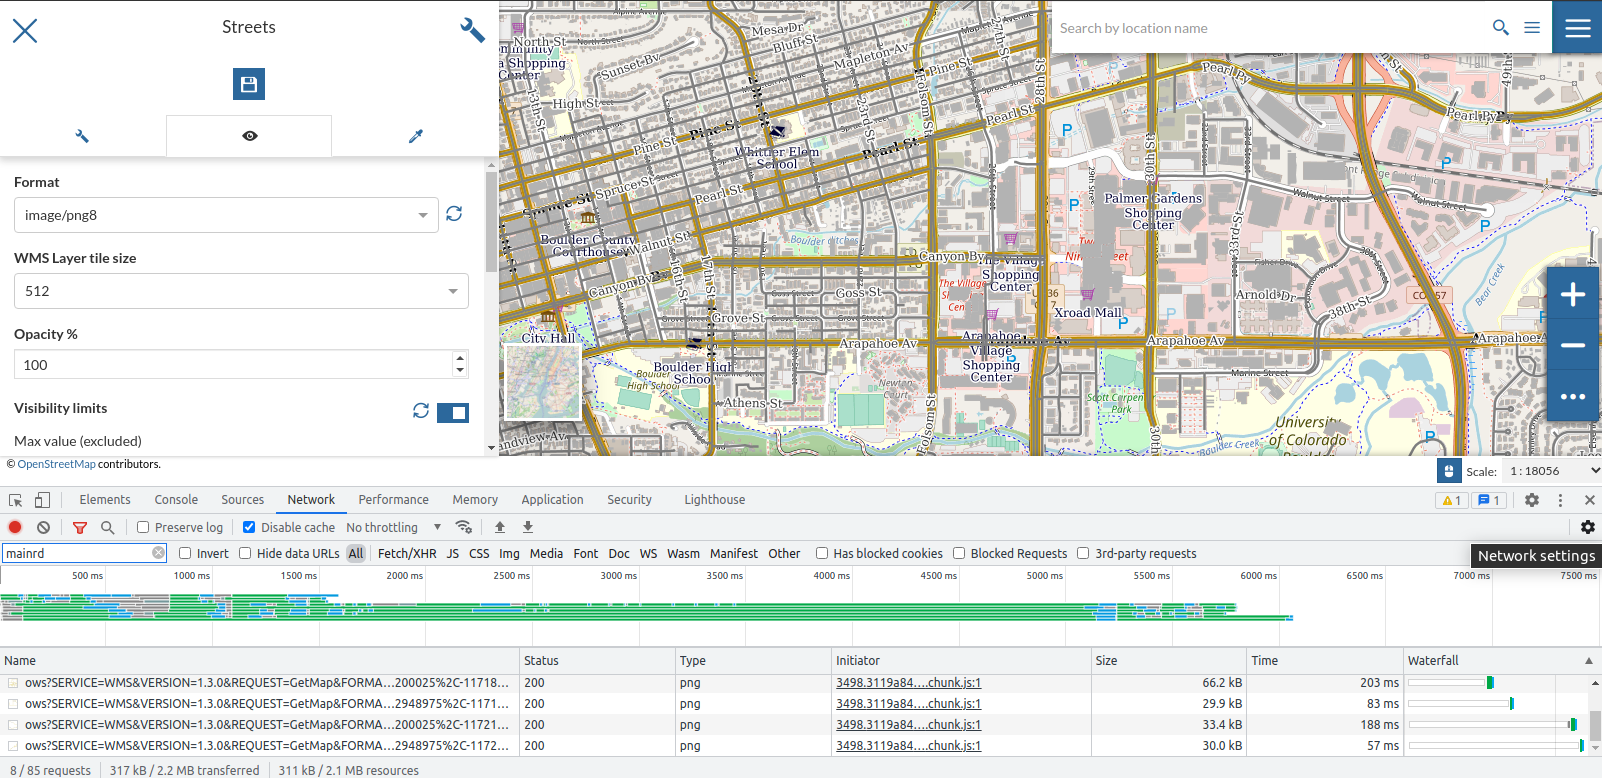
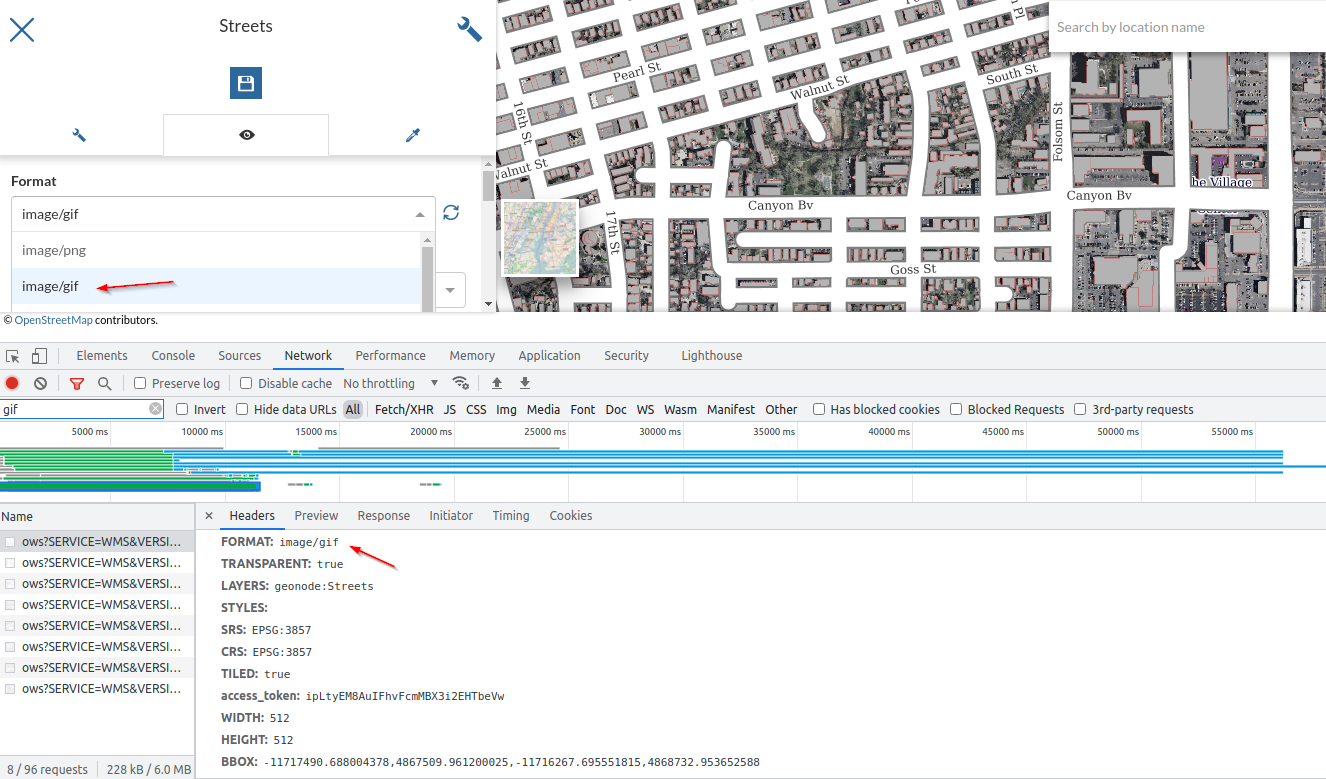
Also, by expanding the
Headerssection, you will notice how thegeowebcacheresponses match with aCache HIT, meaning that we are correctly asking for cached tiles to theWMTSservice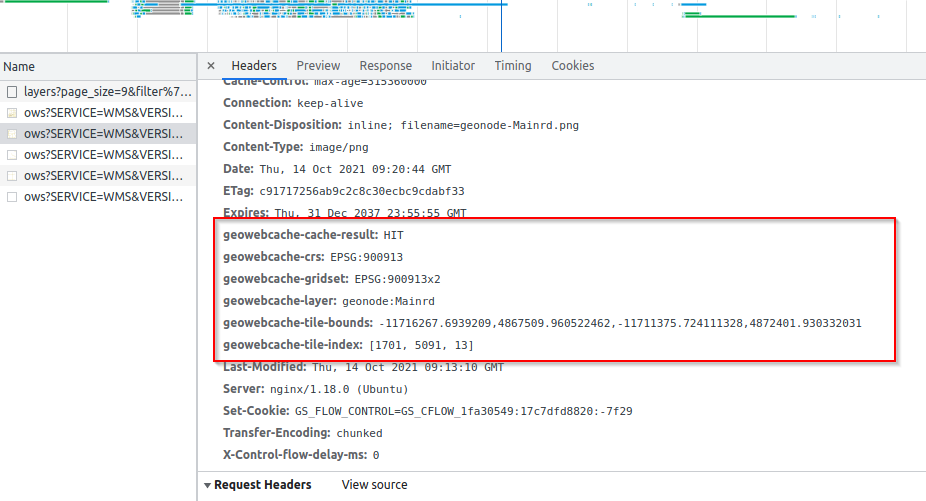
From a map it is possible also to select which one from the available styles (legends) to use on each layer; as an instance let’s use the
CSSstyle for theTrialslayer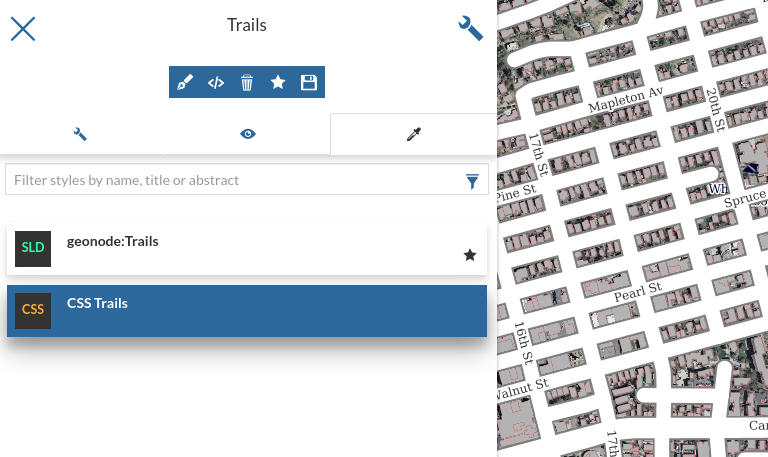
When changing the settings for some layers on a map with many overlays, it is a good practice to temporarly deactivate the others in order to speed up the work, by avoiding to load all of them everytime
Let’s edit the options for the
Mainrdlayer; click on theFilteroption and check theArea of Interestoptions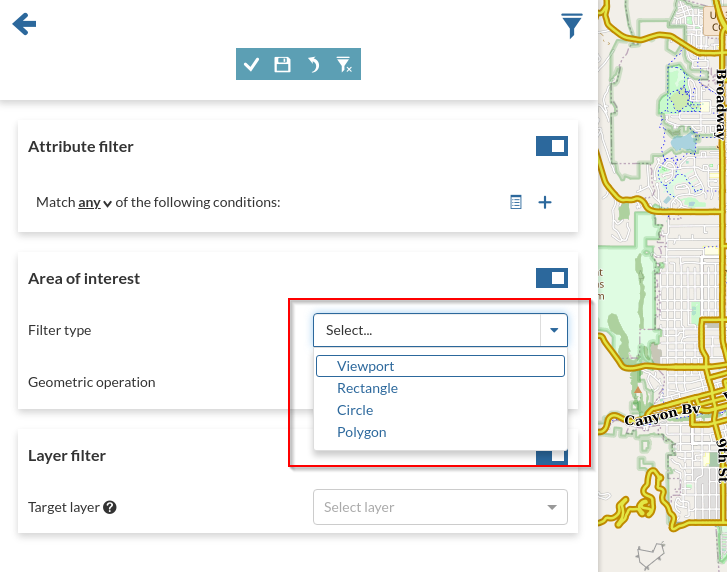
Change the
Filter TypetoPolygonand theGeometry OperationtoContains; draw apolygonon the map and clickApply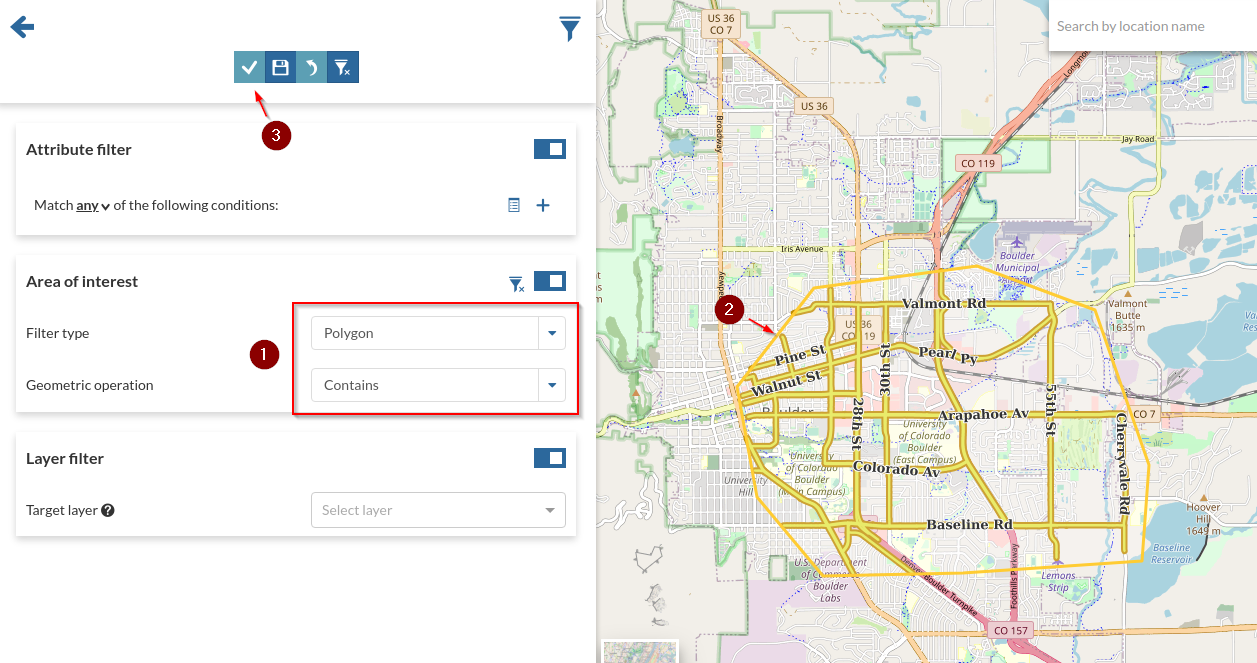
Try modifying the
Geometry OperationtoIntersectsand see the differences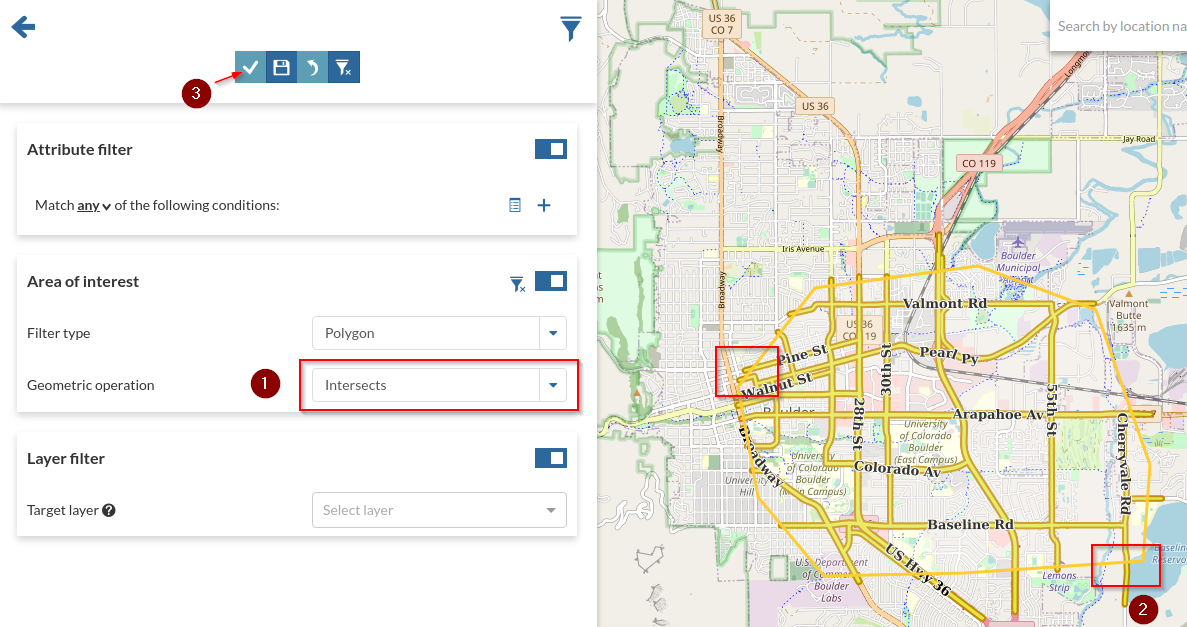
Let’s try some more advanced filtering options; as an instance it is possible to filter the current layer by using the geometries from some other layer on the map. Go ahead and slect the
Streetslayer from theTarget Layerselect box; change theOperationtoIntersects. Add an attribute filter, as an instanceLABEL_NAMEtoColorado Ave. By applying the filter you’ll notice theMainrdshowing only the features matching the intersecting geometries fromStreets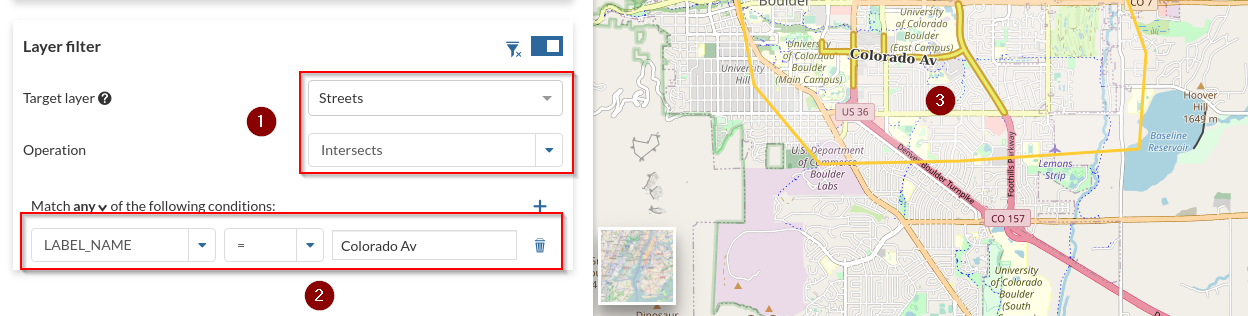
Save the filter and go back to the map; notice that a small
filter iconappears now near the layer name and the map shows only the filtered features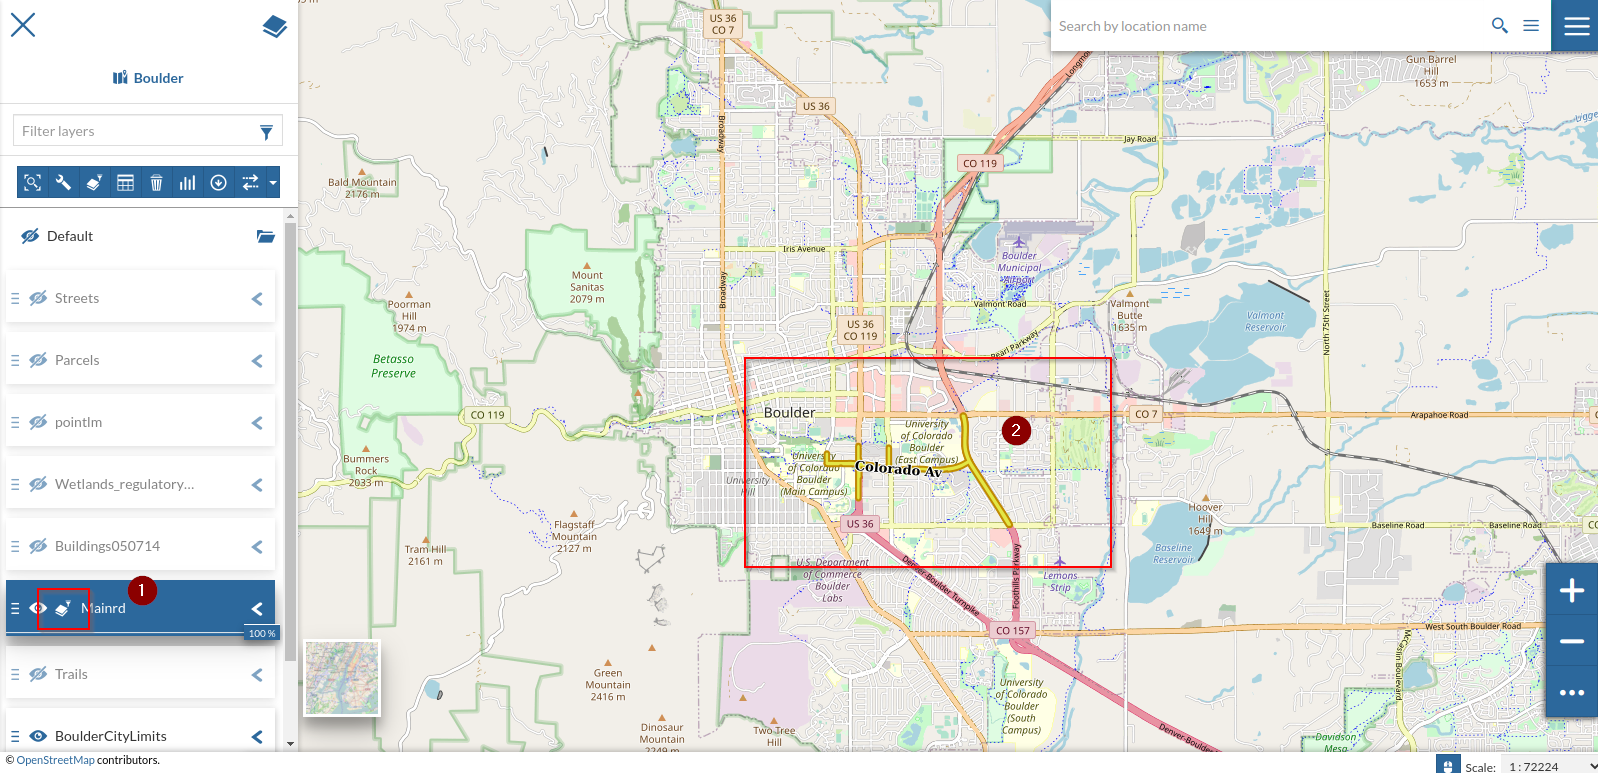
You can optionally persist the changes on the map.
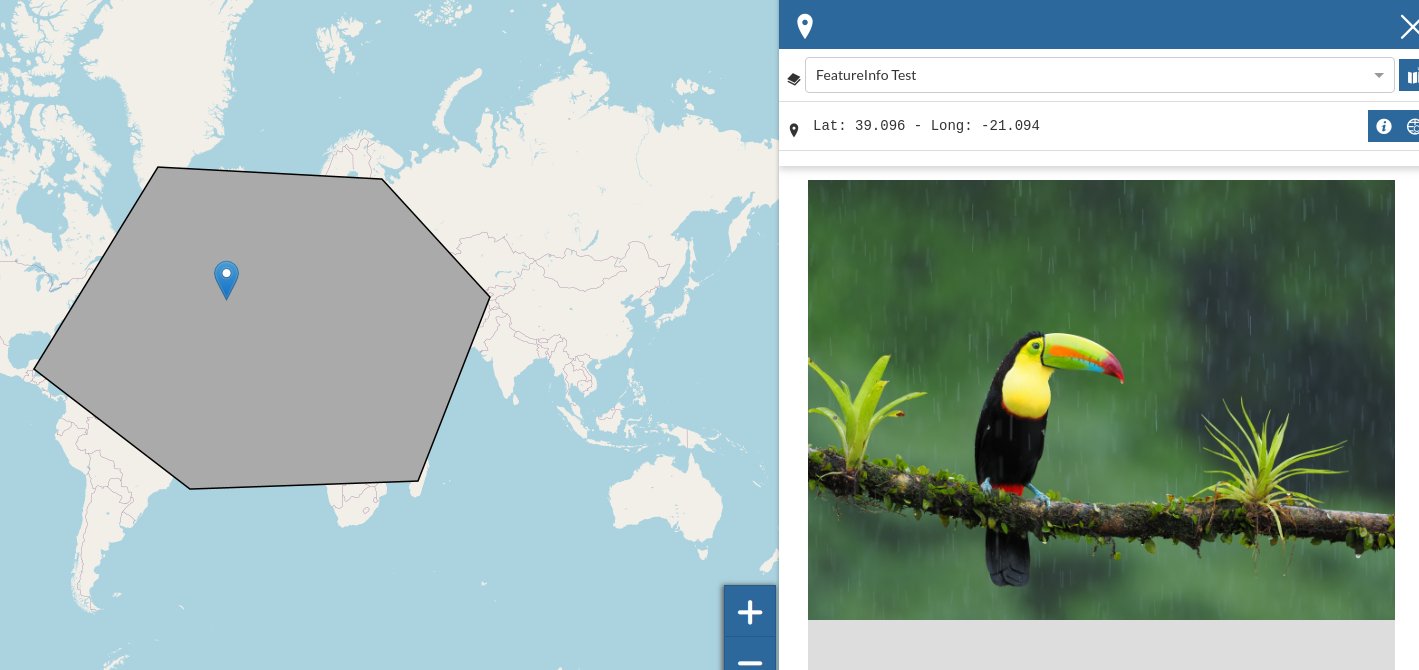
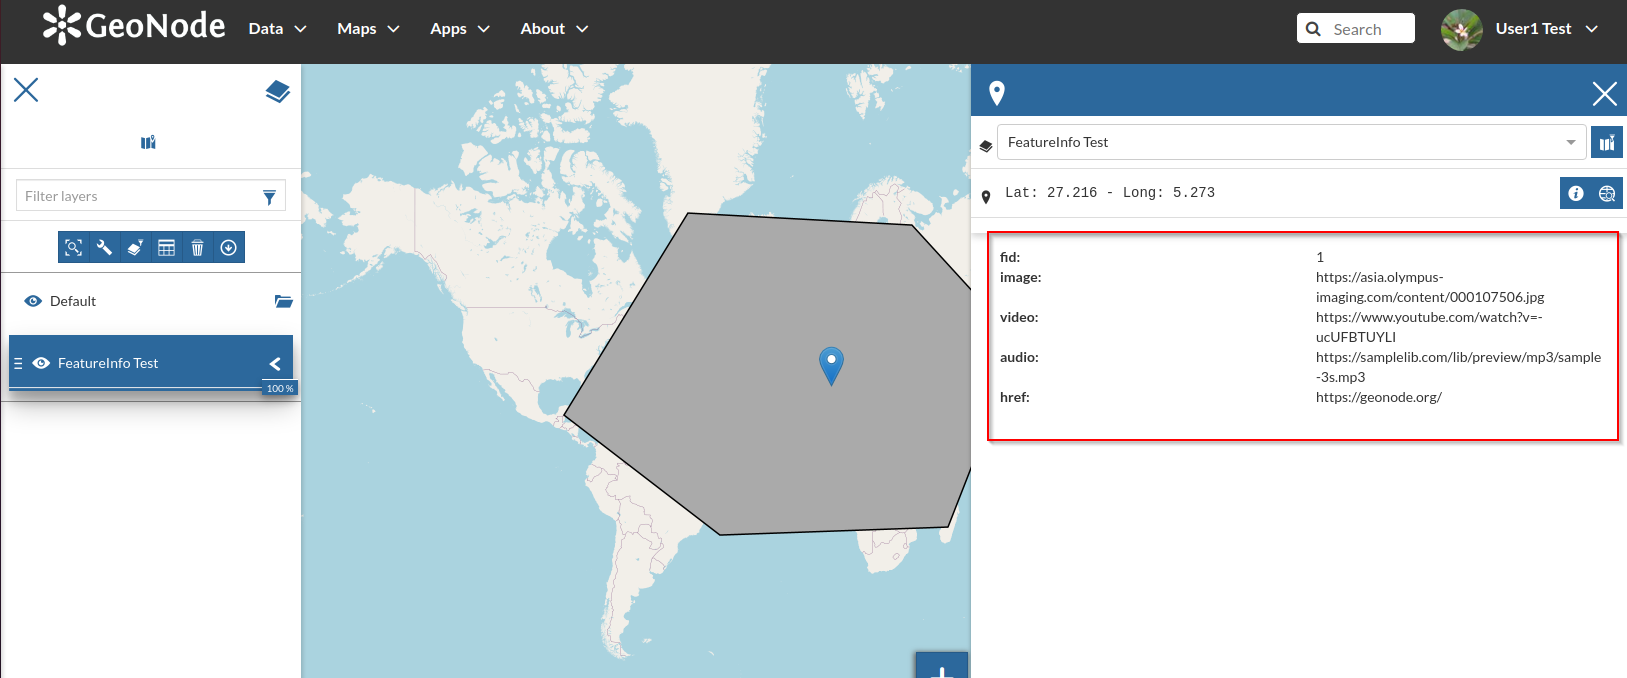
Attributes Media Types Rendering on GetFeatureInfo
The GetFeatureInfo is a special operation on the OWS protocol allwing us to query a layer on a specific position in order to get back the values stored on the backend.
In the case of a VECTORIAL layer, the outcome of the GetFeatureInfo is basically a set of records, i.e. key-value pairs where the keys are the attibutes from the schema below.
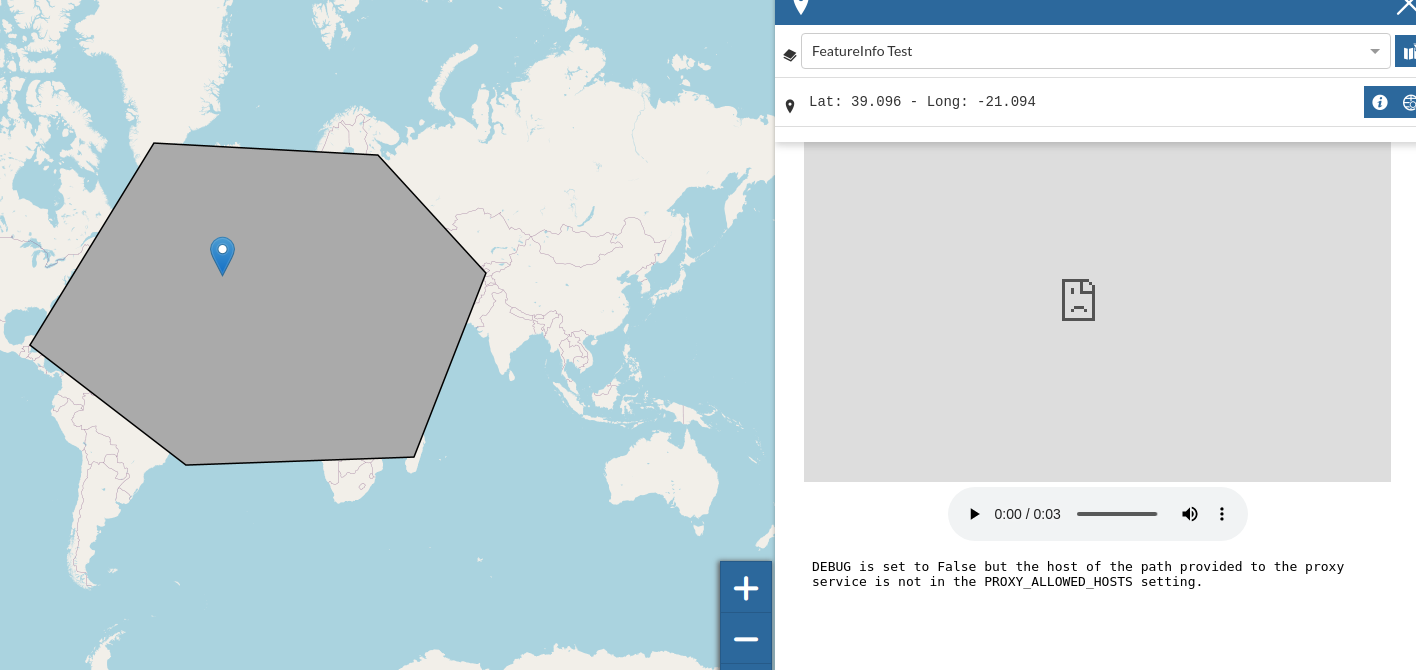
In the simplest use case the outcome of the GetFeatureInfo is a plain text reporting the list of attributes along with the values on that specific location. As you can imagine, the values can be almost anything, even references to external links or media contents, like images, videos or audios.
GeoNode is also able to apply, eventually, an HTML template to the GetFeatureInfo outcome. That means that GeoNode can render the output as an HTML content.
From the layer metadata there’s the possibility to edit such template. In particular there are two different ways to enable it:
Basic; GeoNode will simply present the list of the available
attributesallowing the user to change the order, visibility andmedia-typeon each one.Advanced; GeoNode will present a
rich-texteditor panel allowing the user to define its own customHTML template.
In this section we will see how the basic one works by defining and editing a new empty layer.
Let’s first create a new
empty layerwith the following attributes:geometry type:Polygonimage:Stringvideo:Stringaudio:Stringhref:String
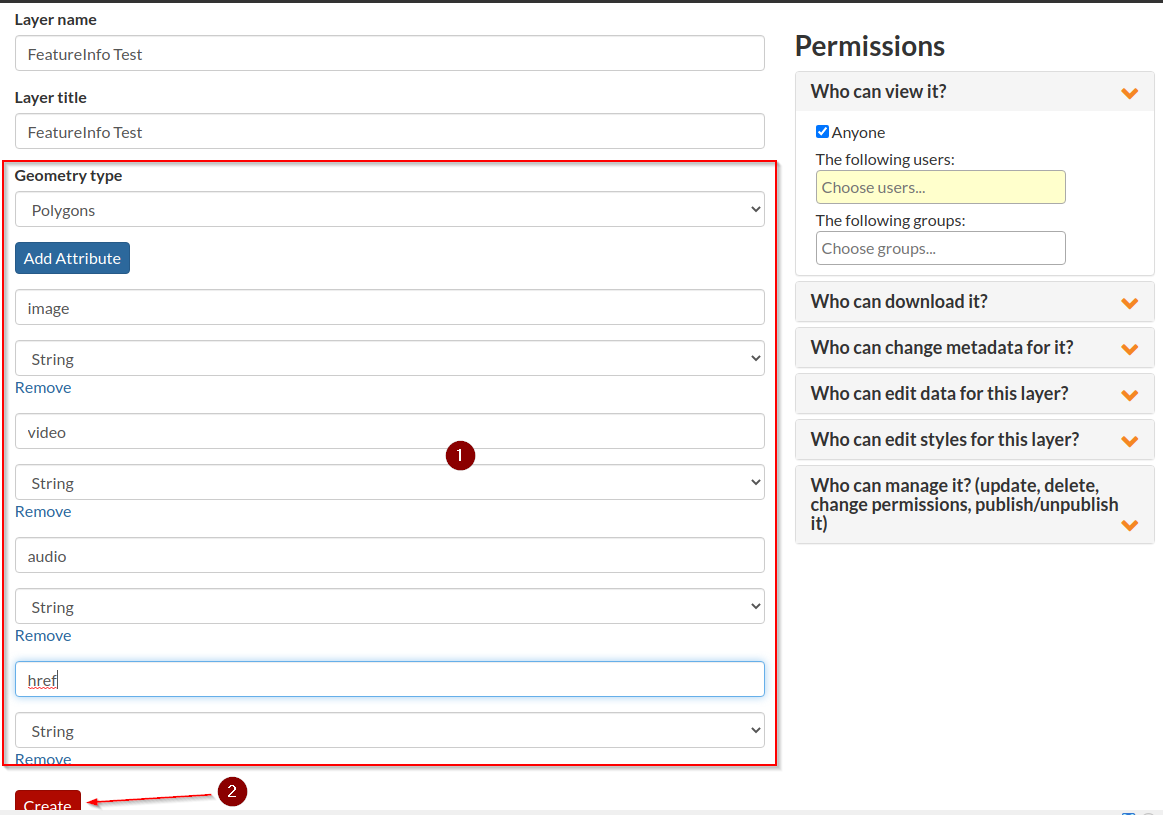
Edit the layer data and add a new
polygon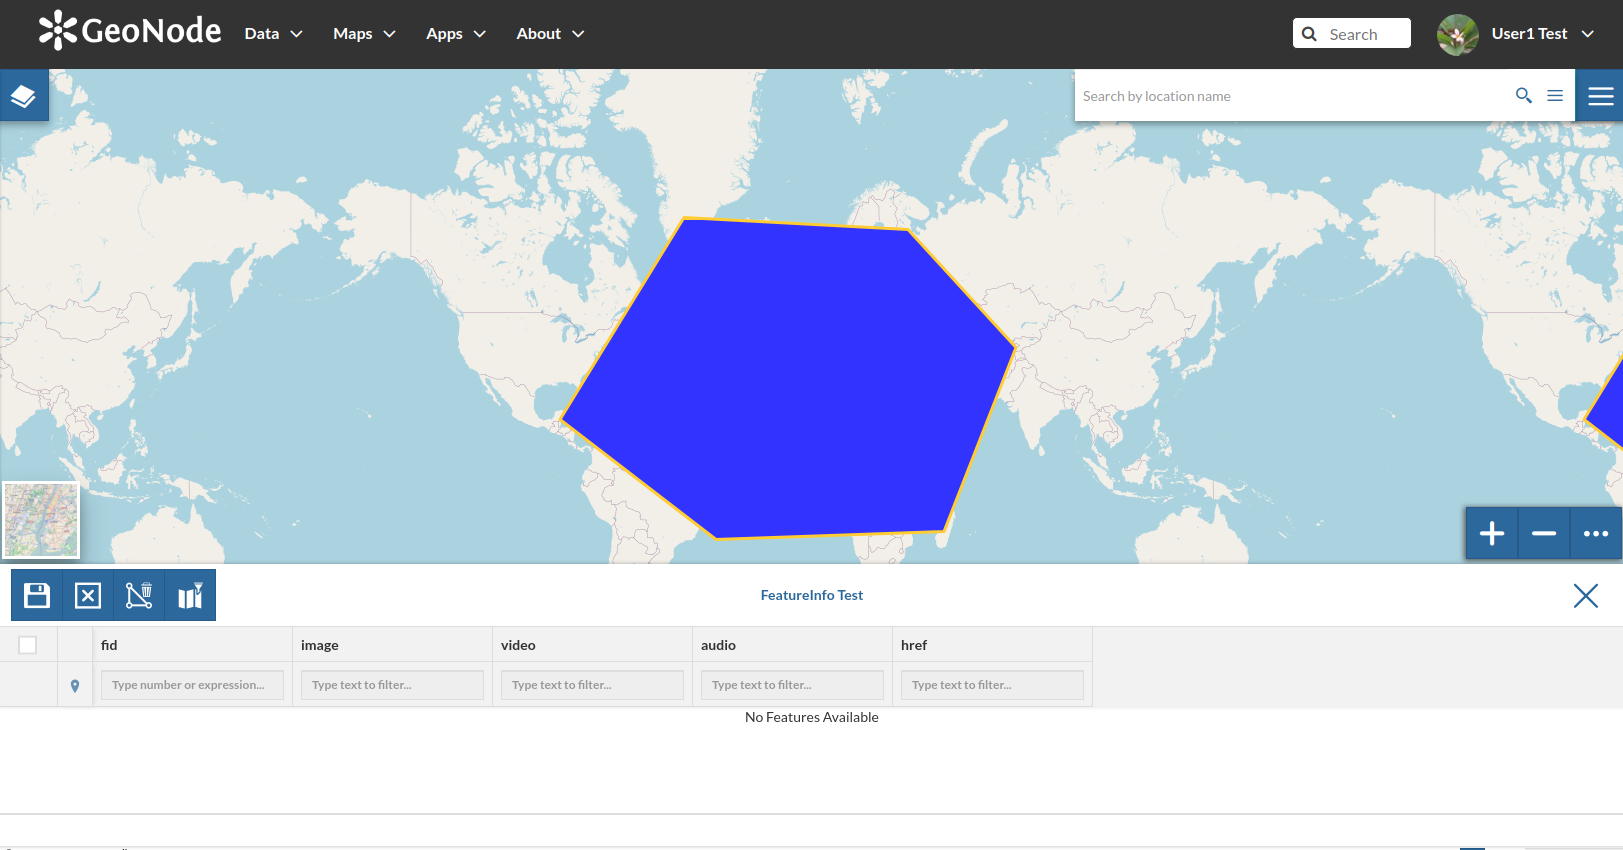
Fill the
attributeswith some links, e.g.image:https://asia.olympus-imaging.com/content/000107506.jpgvideo:https://www.youtube.com/watch?v=-ucUFBTUYLIaudio:https://samplelib.com/lib/preview/mp3/sample-3s.mp3href:https://geonode.org/
Save, click on the polygon and check the results
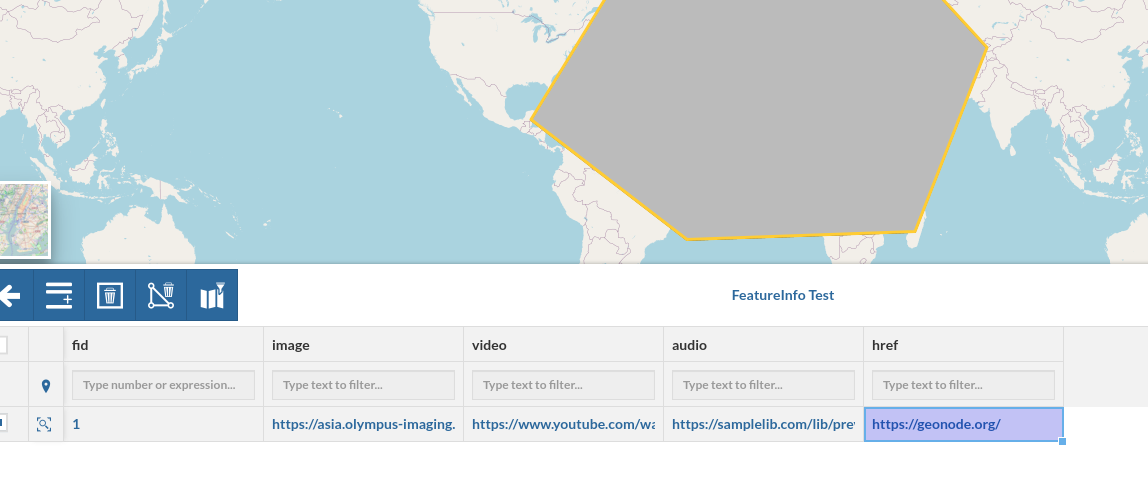
Now go back to the layer details, edit the metadata and move to the
Attributestab; change the contents as shown in the figure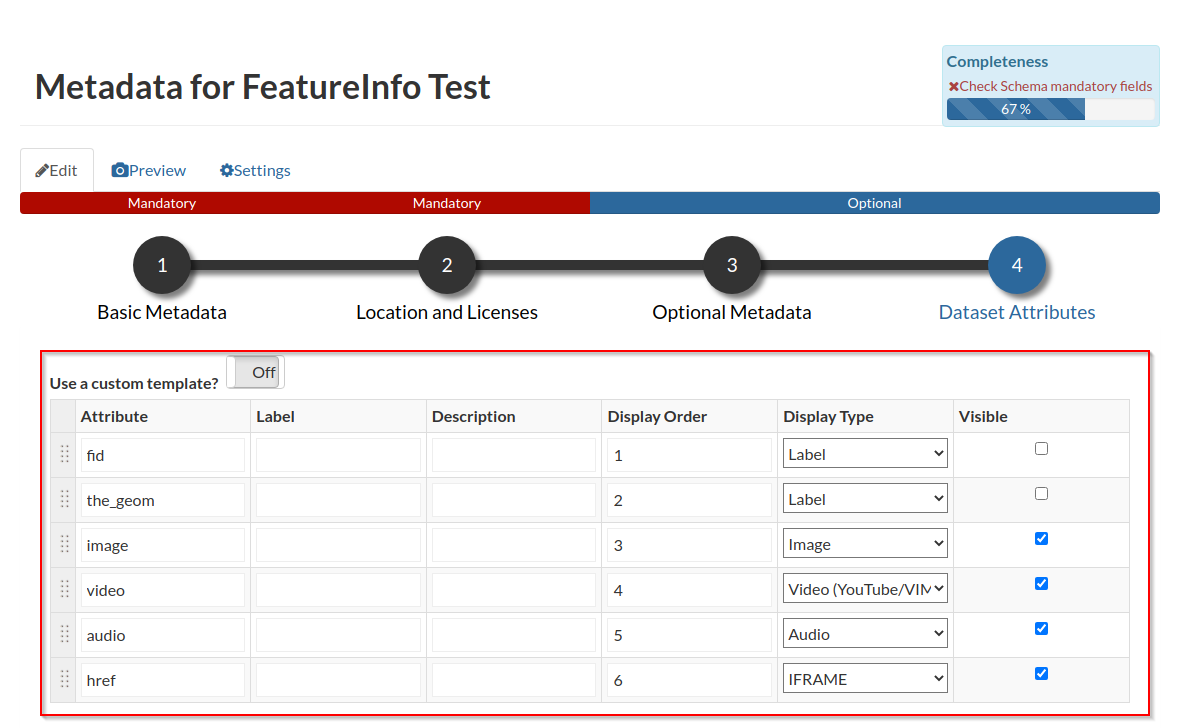
Save, visualize the layer and click again on the polygon