Adding our first Dashboard
A Dashboard is a space where a user can add many miniature items, such as charts, maps, tables, texts and counters, and can create connections between them in order to provide an overview for a better visualization of the data, interact spatially and analytically with the data by creating connections between maps and charts and/or perform analysis for better decisions.
Add world layer and create a simple map
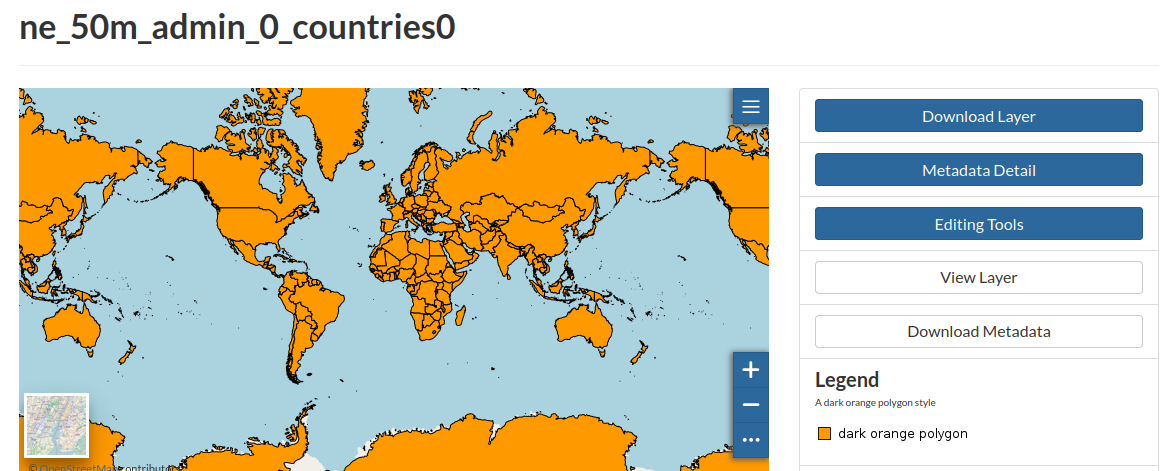
Like in previous upload layers steps, follow the path to /opt/data/sample_data/pretty_maps/data and upload the shapefile with name ne_50m_admin_0_countries.
Once upload finishes, layer detail page will look like this:
Create a Dashboard
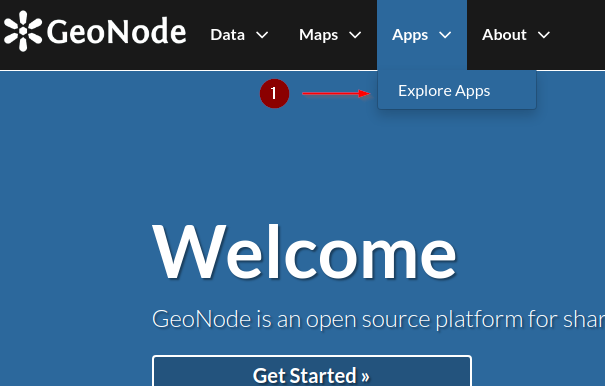
From the menu Apps follow the link Explore Apps
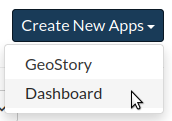
Once on the Apps list page click the button Create New Apps on top right corner and select Dashboard from the drop-down menu.
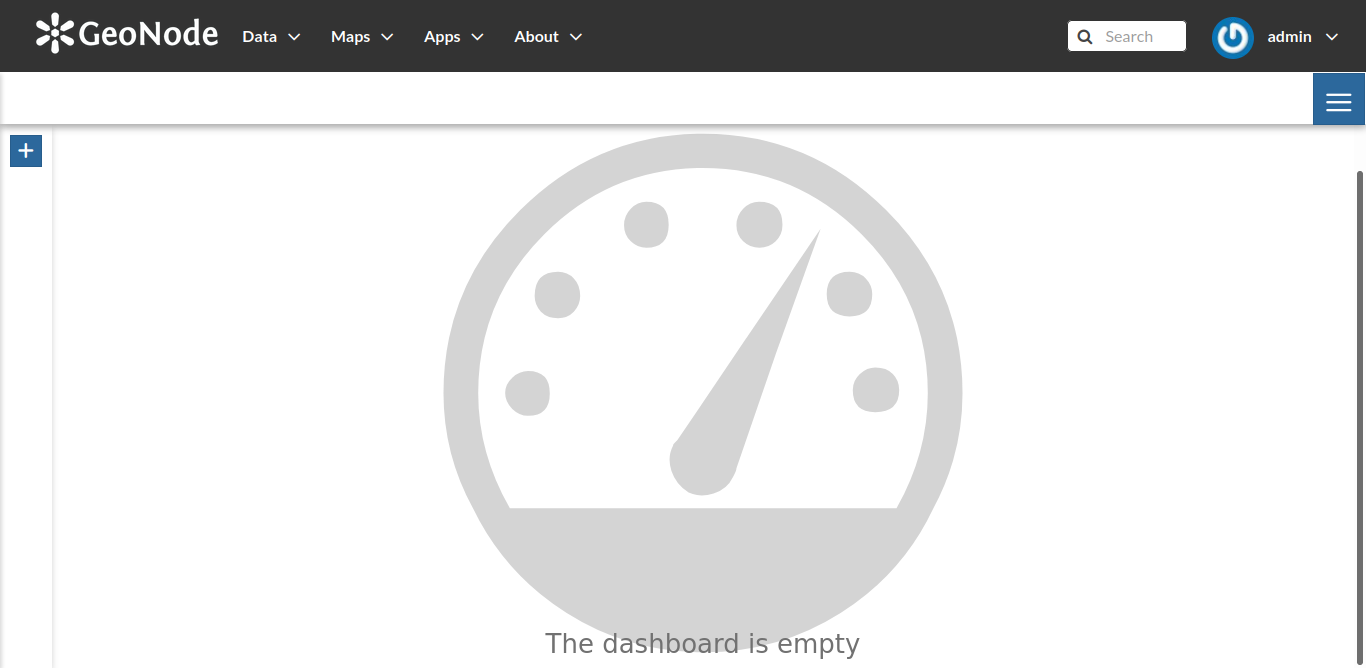
You will be presented an empty dashboard page ready to be populated.
Click on the Add icon  to add new widgets.
The Widget page will open on the left showing a list of items that can be created and added to the dashboard.
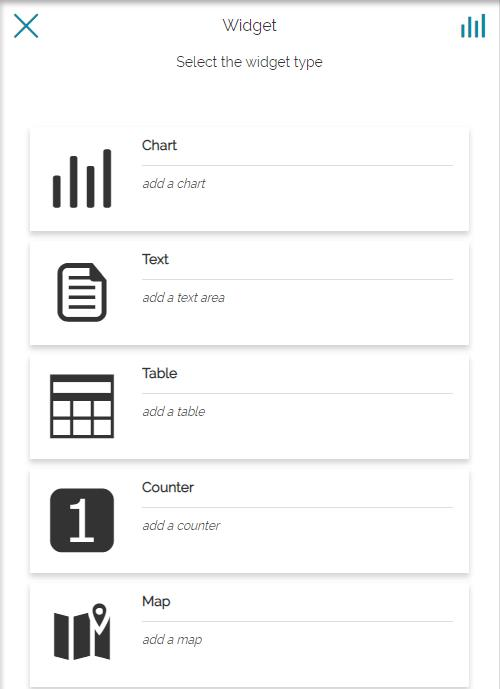
Add map widget
Let’s add our first widget to our dashboard, the Map widget type
Click the Map widget button and you’ll be redirected to a list of GeoNode existing maps. Choose our previously created World Population map and click the right arrow  to add this to our dahsboard.
Once added, you can configure some map options, such as info tool disable/enable  or add other layers to the existing map using the plus
  button.
For now let’s just proceed without changing the map options by clicking again the right arrow button
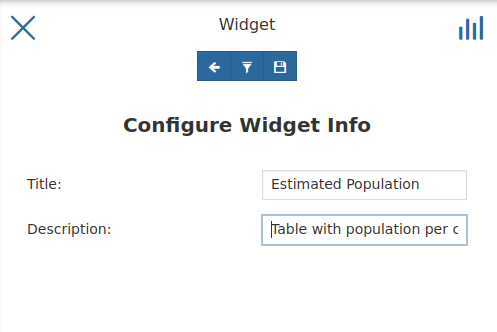
On the last step for creating the Map dashboard widget you are asked to provide a Title and a Description for you widget. Add there some relevant information as below:
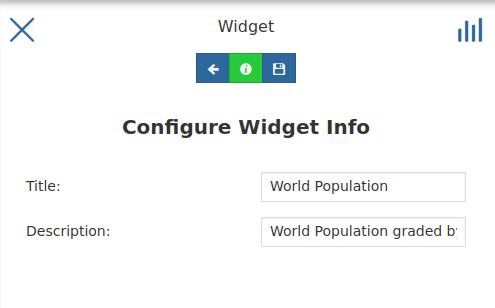
Finally save it using the floppy disk button 
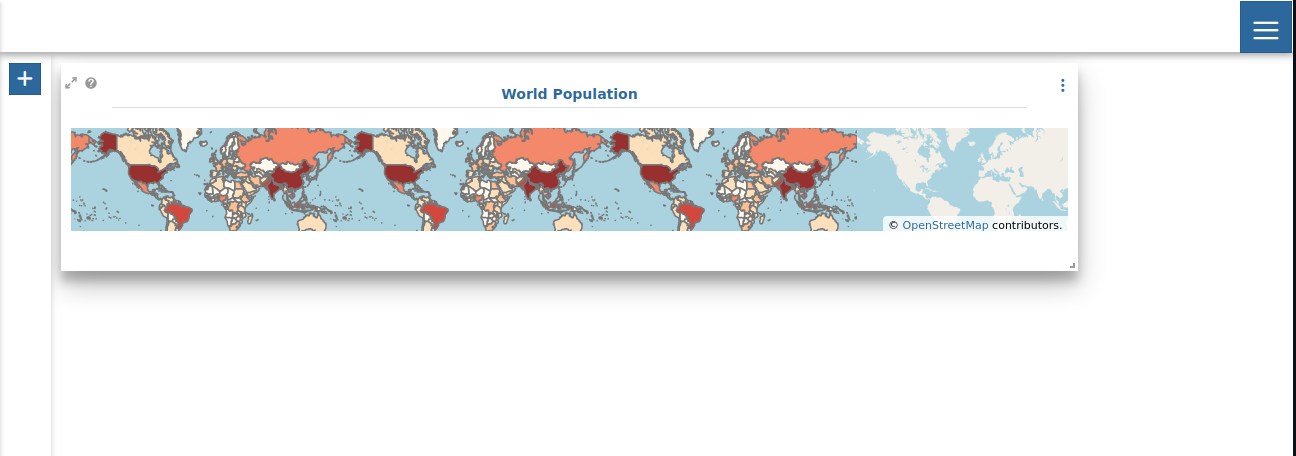
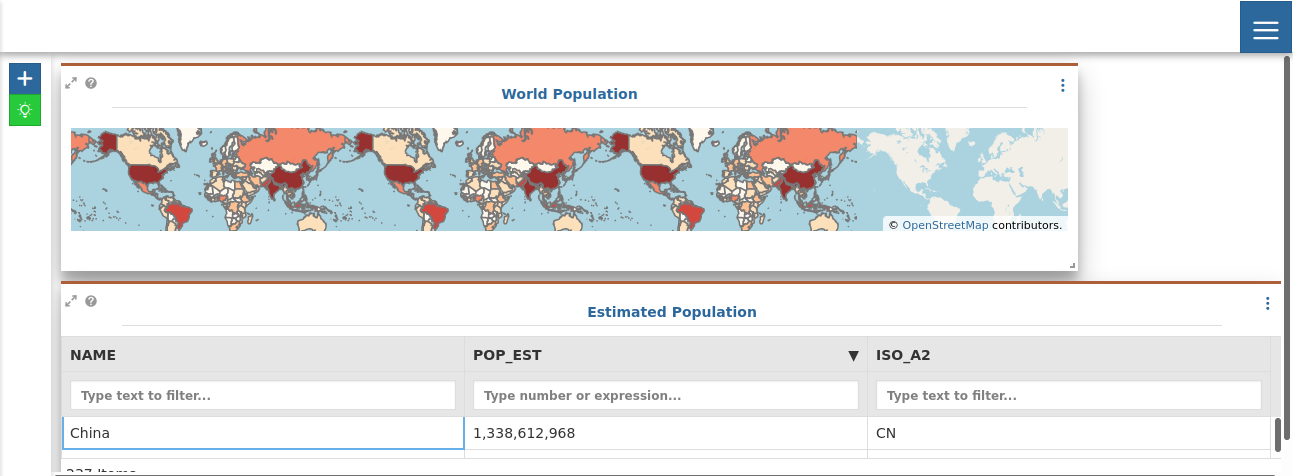
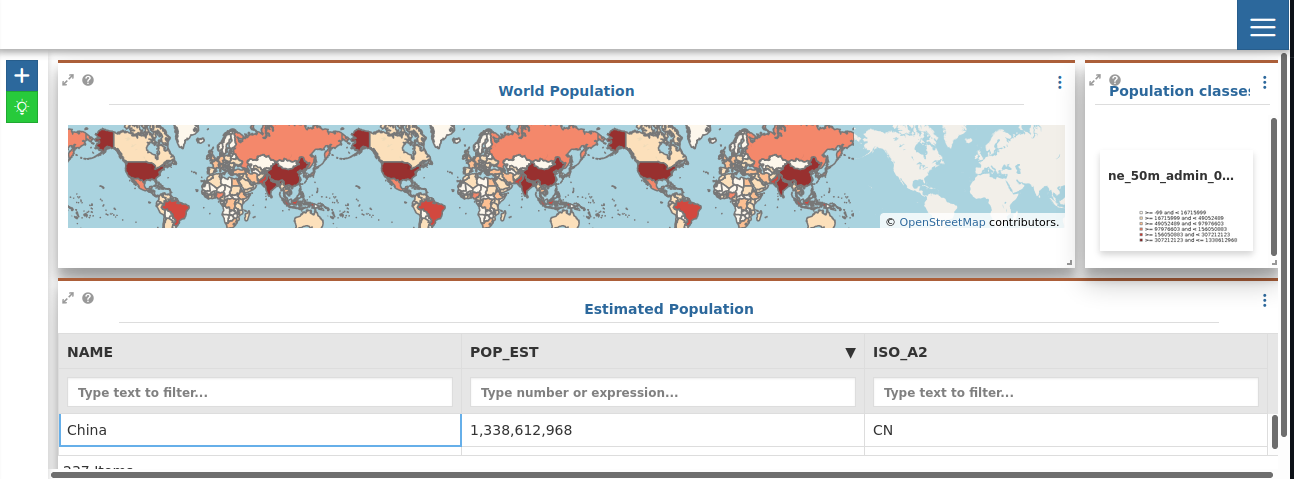
Now we can see our Mapwidget on our dashboard. Resize the widget so that it can cover the most of the area of your dashboard. Just leave some space at the botton and to the right of the dashboard canvas area as shown below:
Add table widget
At the botton of our dashboard canvas we will include another type of widget, the Table type widget.
Click again on the add widget button to add one more widget to our dashboard.
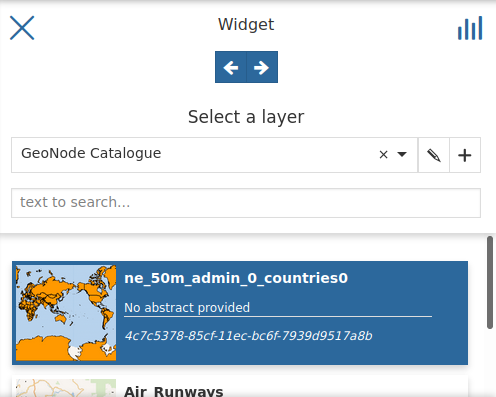
From the widget list, select the Table widget type.
Once selected your will be redirected to GeoNode list of available layers. If you did not renamed previously our world population layer, choose the layer ne_50m_admin_0_countries0layer from the list.

Once selected, click againg the right arrow button to proceed.
On the next step you will be asked which fields you want to show on the dashboard table widget. In this case we will only choose fields, NAME, POP_EST and ISO_A2
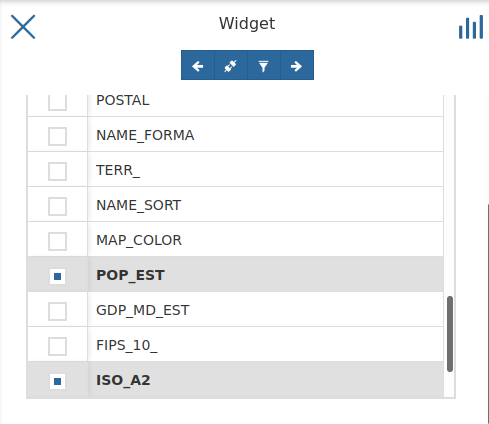
Before proceeding, please also enable the connect widget button  by clicking on it.
Once again in the last step we’ll need to provide a title and description for our widget.
At the end, click again the floppy disk button to save and add the widget to our dashboard.
Place it at the bottom of our dashboard and change the widht of it to cover all the bottom area.
Add legend widget
Next we will add a legend widget to our dashboard in order to make the map color classes more readable.
Click on the plus button to add a new widget and from the list choose Legend widget type.
You should see the legend for our world population map layer (ne_50m_admin_0_countries0) on the preview of the legend widget area.
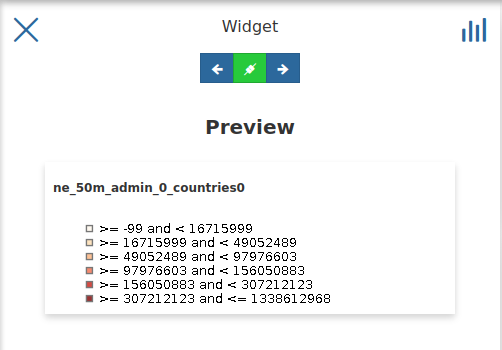
Let’s move on by clicking the right arrow button .
Again, the final step is to provide a Title and a Description to our widget.
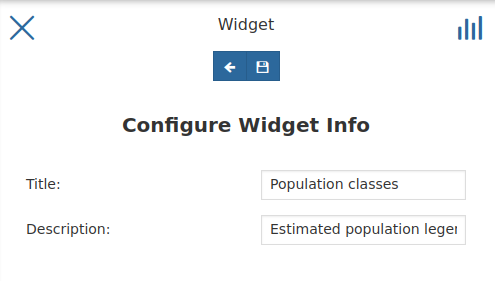
Once done, save it and add the widget to the map by clicking the floopy disk button .
Move the widget and place it near the empty area to the right of our existing map. Adjust widgets sizes if needed to have a dashboard configuration similiar to the next picture.
Add counter widget
As a final trial to our dashboar we will include a Counterwidget type in order to provide the total number of countries in the world.
From the add more widget button choose the widget type Counter from the list.
Again, it will show a list of available layers to choose from. Choose again the ne_50m_admin_0_countries0 layer.
Let’s move on by clicking the right arrow button .
Now we need to configure our widget and from the configuration page we can see:
Use- The property/column field to use for our calculationOperation- The available field level calculation available (COUNT,SUM,AVG, etc…)
Let’s use the field fid and the operation count for this exercise.
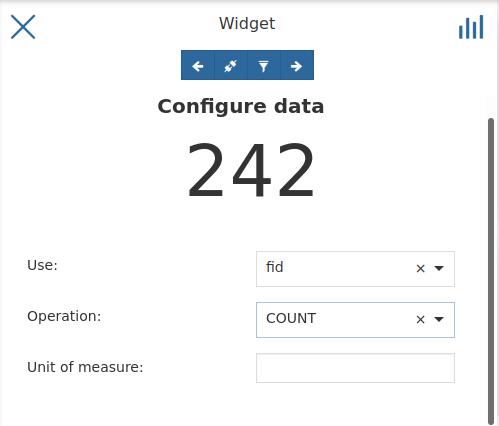
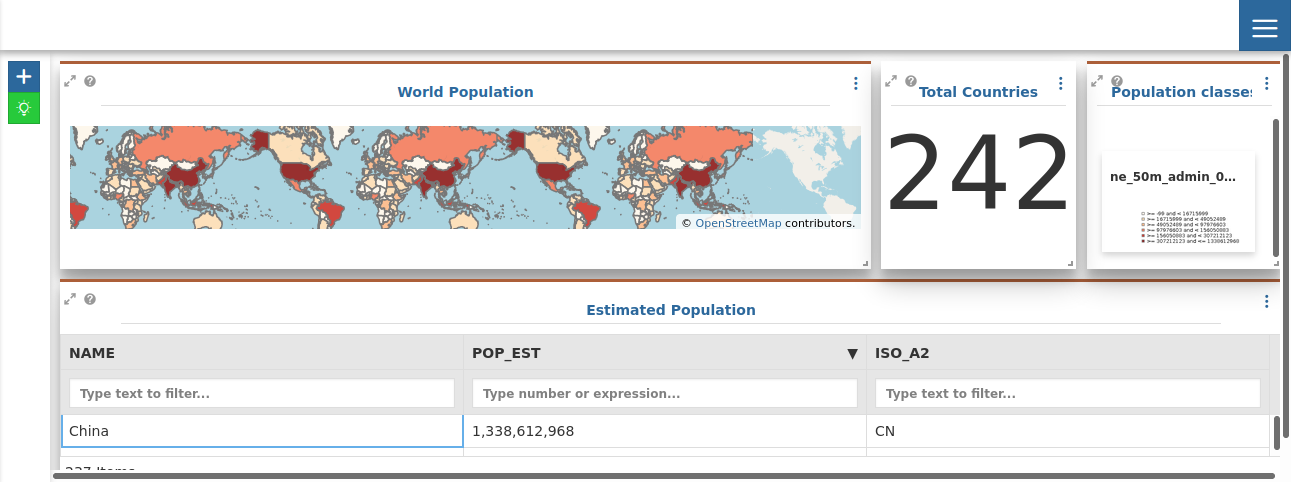
You should see already in the preview the total number of countries in the layer (242)
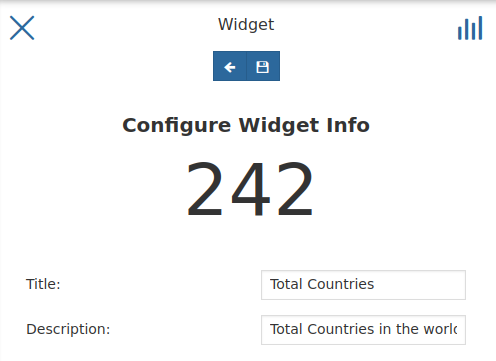
Click the right arrow button . and again add a title and description to our configured widget.
Final step is to save the widget and place the widget on our dashboard using the floppy disk button . Feel free to place it somewhere as you will need to rearrange other existing widgets to allow our new Counter widget to be clearly visible.
Congratulations!! You have built your first simple dashboard with GeoNode!