# Pretty Maps with GeoNode
## Introduction to Web Map Service
A Web Map Service provides:
* A set of **layers** (each in its own map projection)
* One or more named **styles** per layer (at least one)
* Ability to **request any list of layers** with their styles to build a map
* A set of target **projections** in which the map can be composed
* Ability to ask “any” map size and scale denominator
* Optional ability to **query the map** (info tool, “what’s here?”)
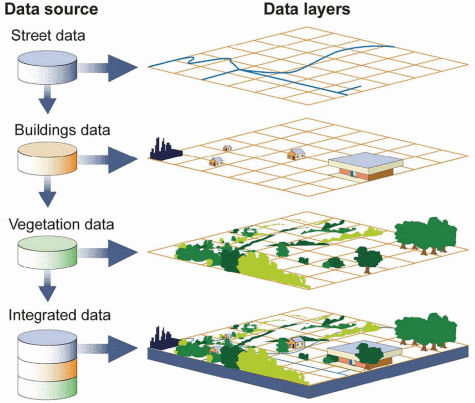
The flexibility of this model allows clients to build their own maps, selecting only the layers of interest, and integrating map layers from different servers (assuming there is at least one common target projection among the servers), and using local data too if needed.
This introduction showcases the `WMS 1.1` protocol version, as it’s easier to explain compared to the newer 1.3 version, in which a different axis order must be used depending on the requested coordinate reference system. The main concepts are very similar, and so are the requests.
### GetCapabilities
Like most `OGC` protocols, `WMS` exposes a `GetCapabilities` request. To see the full contents of the local `GeoServer WMS 1.3 capabilities` document follow this link:
```
http://localhost/geoserver/ows?service=wms&version=1.3.0&request=GetCapabilities
```
The result is a very large `XML` document, meant to be parsed by a computer, here we’ll look only at some highlights.
#### The service section
This section provides a way to describe the service contents (title, abstract) and points of contacts that can be used to inquire about the service, report issues and the link.
The contact information comes from the homonymous configuration page in the `Contact information` menu of the `GeoServer administration interface`.
```xml
WMS
GeoNode Local GeoServer
This is a description of your Web Map Server.
WFS
WMS
GEOSERVER
NONE
NONE
```
#### The capability section
This section reports which requests the server can handle, and some information about the requests, such as the output formats.
Did you know that:
* Not all requests are mandatory, only `GetCapability` and `GetMap` are, `GetFeatureInfo` is not
* Only one among `PNG`, `JPEG` and `GIF` `GetMap` output format is required, but look at how many GeoServer supports
```xml
text/xml
image/png
application/atom+xml
application/json;type=utfgrid
application/pdf
application/rss+xml
application/vnd.google-earth.kml+xml
application/vnd.google-earth.kml+xml;mode=networklink
application/vnd.google-earth.kmz
image/geotiff
image/geotiff8
image/gif
image/jpeg
image/png; mode=8bit
image/svg+xml
image/tiff
image/tiff8
image/vnd.jpeg-png
image/vnd.jpeg-png8
text/html; subtype=openlayers
text/html; subtype=openlayers2
text/html; subtype=openlayers3
text/plain
application/vnd.ogc.gml
text/xml
application/vnd.ogc.gml/3.1.1
text/xml; subtype=gml/3.1.1
text/html
application/json
...
```
#### The Contents section
This section in `WMS` contains a tree of layers.
The tree has several consequences:
* It’s a way to organize data by themes
* It’s a way to group layers, asking for one layer makes the server return all its child layers, in the order they are defined.
* Allows inheritance, the properties of the parent layer are inherited by all child layers
The contents section starts with a root layer that can be used to get all layers in a single shot, and that lists all the target projections map can be reprojected into.
By default GeoServer lists all those found in the `EPSG` database, and it can be configured by setting the `Limited SRS list` in the GeoServer `WMS admin` page:
```xml
GeoNode Local GeoServer
This is a description of your Web Map Server.
EPSG:4326
EPSG:3785
EPSG:3857
EPSG:900913
EPSG:32647
EPSG:32736
CRS:84
-117.36526677636073
-105.00013888888888
32.534227762958466
40.30013888888889
...
```
After the list of coordinate reference systems, the actual layers show up with their own bounding box, styles, and legend reference:
```xml
geonode:Air_Runways
Air_Runways
Airport Runways
features
Air_Runways
Runway
Airport
Airports
Runways
Landing Strips
EPSG:2230
CRS:84
-117.36526677636073
-116.12621141861304
32.534227762958466
33.36158563104289
...
```
This section allows the client to figure out which layers are available, where they are located, what coordinate reference systems can be used in requests, thus building the GetMap request.
### GetMap
The `GetMap` request allows a client to ask the server to generate a portryal of a layer given a specific style (it will use the default one if none has been provided).
A `GetMap` request is a `HTTP GET` uri with a well-defined `query-string`; as an instance the following one is a typical `GetMap` request:
|Element | Description|
|----------|------------|
|http://localhost/geoserver/geonode/wms? | The base URL|
|service=WMS|The service|
|version=1.1.0|The service version|
|request=GetMap|The request|
|layers=geonode:states|The list of layers (comma separated, can be one)|
|styles=|The list of style names (comma separated, can be empty to use the default)|
|bbox=-124.73142200000001, 24.955967,-66.969849, 49.371735|The area that should be depicted|
|width=768|Width of the output in pixels|
|height=330|Height of the output in pixels|
|srs=EPSG:4326|The output coordinate reference system (the BBOX is expressed in this SRS)|
|format=image/png|The requested format (could have been image/png, image/jpeg, or any other listed in the capabilities document)|
### GetFeatureInfo
The `GetFeatureInfo` request allows a client to issue a “what’s here” request for one or more of the requested layers.
The “here” is specified by giving the coordinate of the pixel that the user clicked, inside the `GetMap` output the user is looking at.
As an example, go to any of the layers' details page and click on a point of the map corresponding to some data. You'll get information about the data on that specific position.
## Creating a Base Map
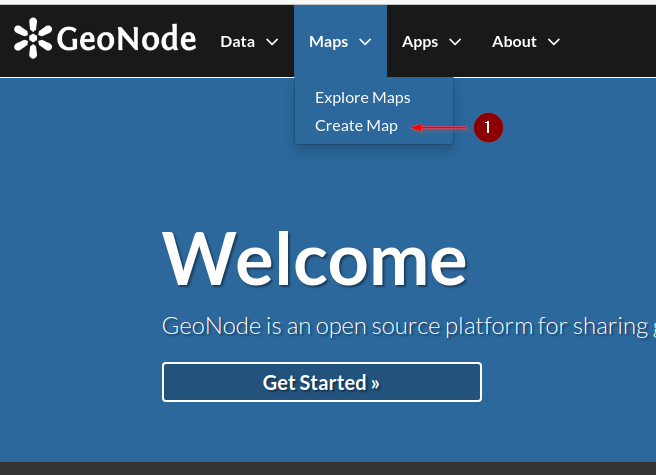
- From the `Maps` dropdown menu on the `navbar`, click on `Create Map` link
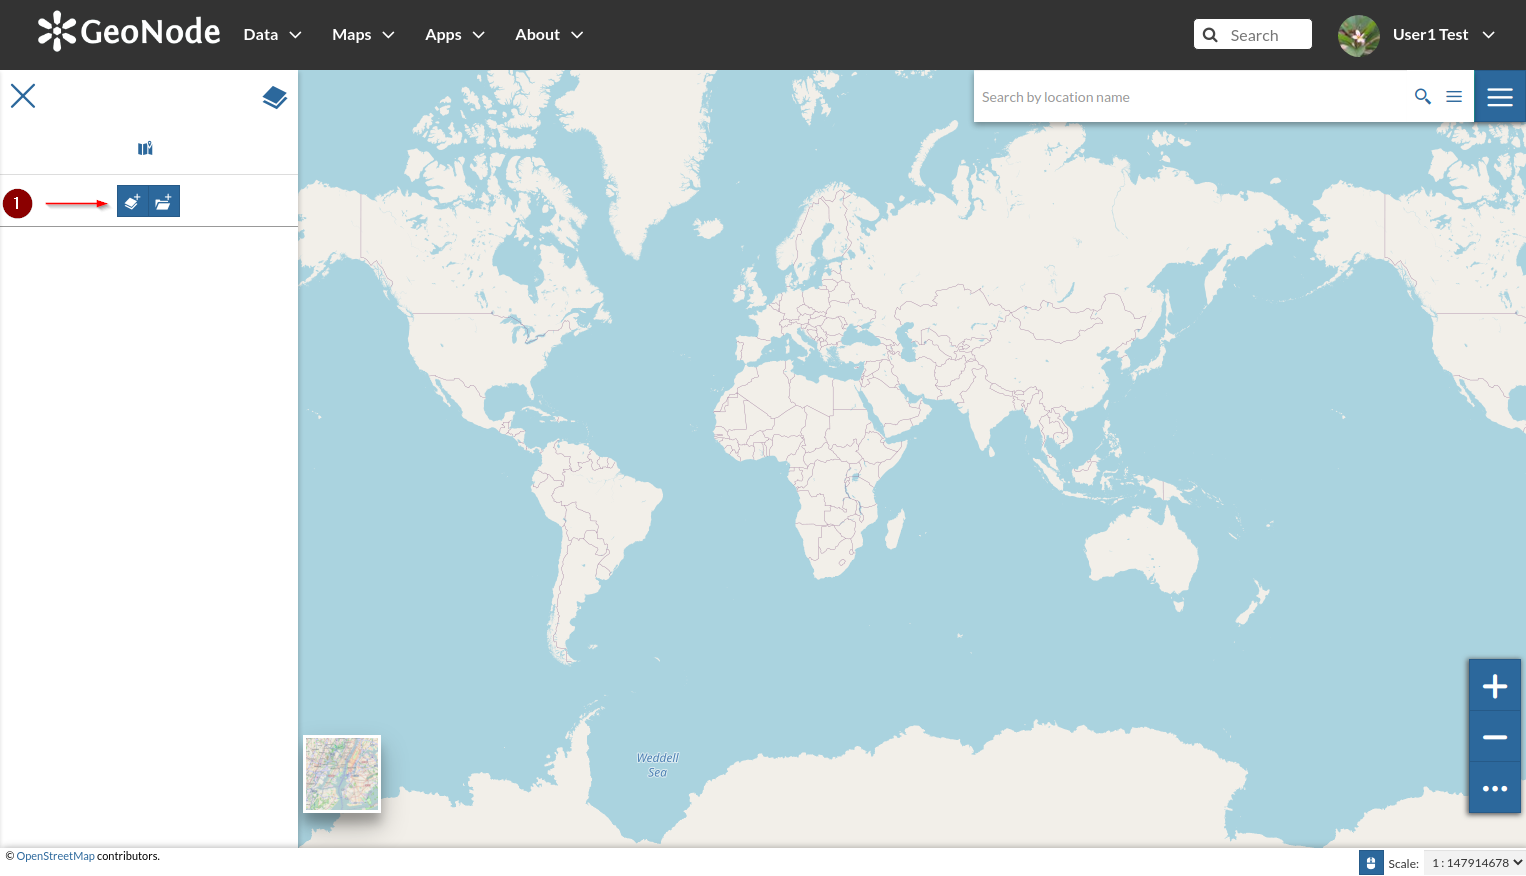
- GeoNode will show an empty map with a default background; from the `burger menu` on top-left corner, click on the `Add Layers` button
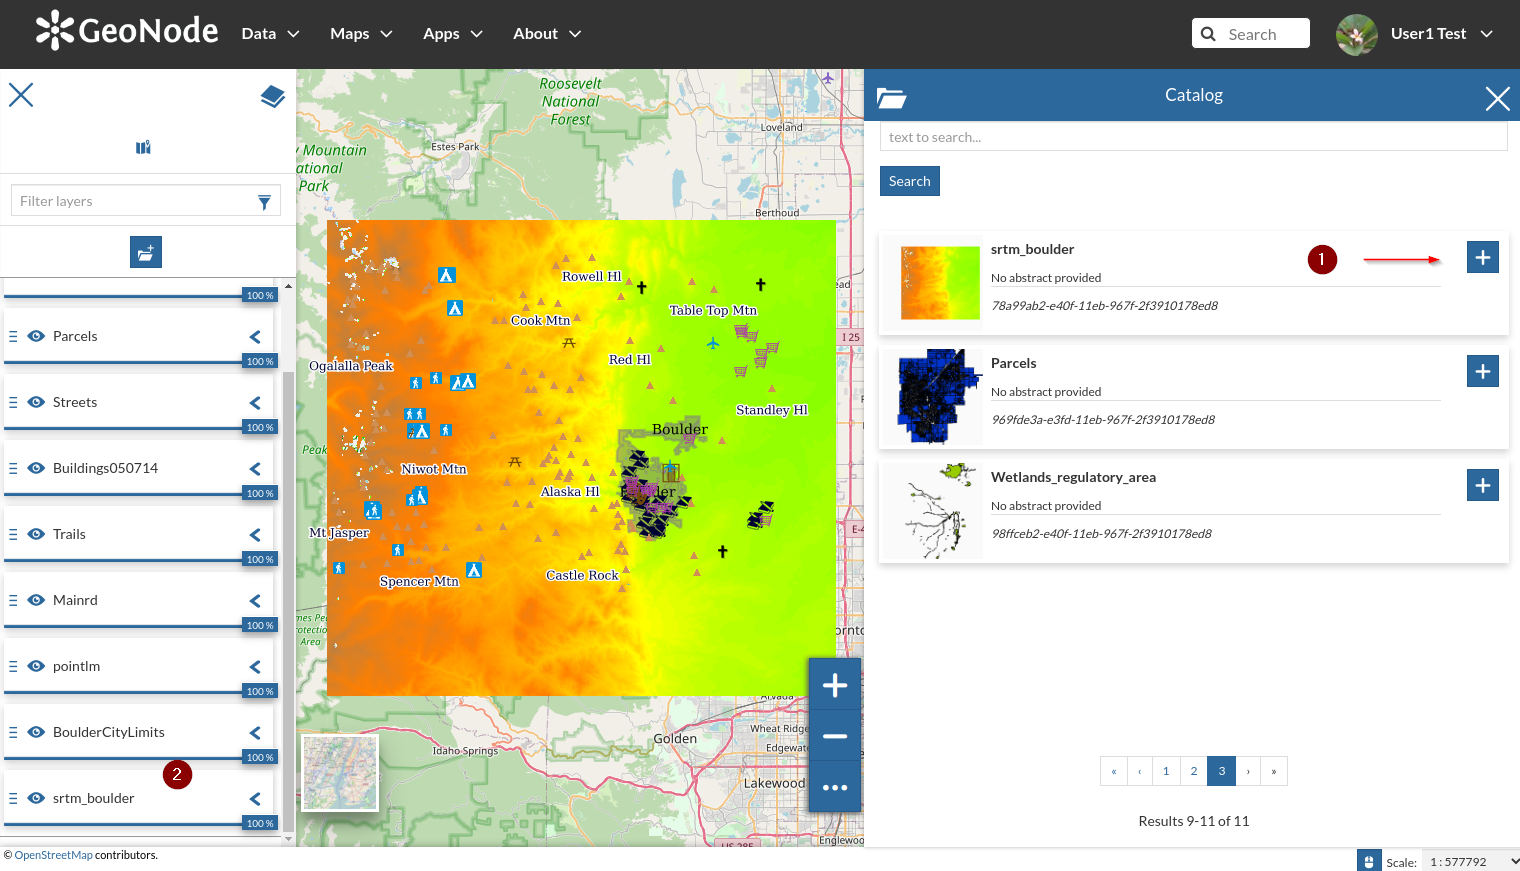
- The catalog side menu will appear by showing the available layers; start adding the overlays as shwon in the figure below.
**WARNING**: the order of the overlays is important on a map; you can always change the order by dragging the layer up and down
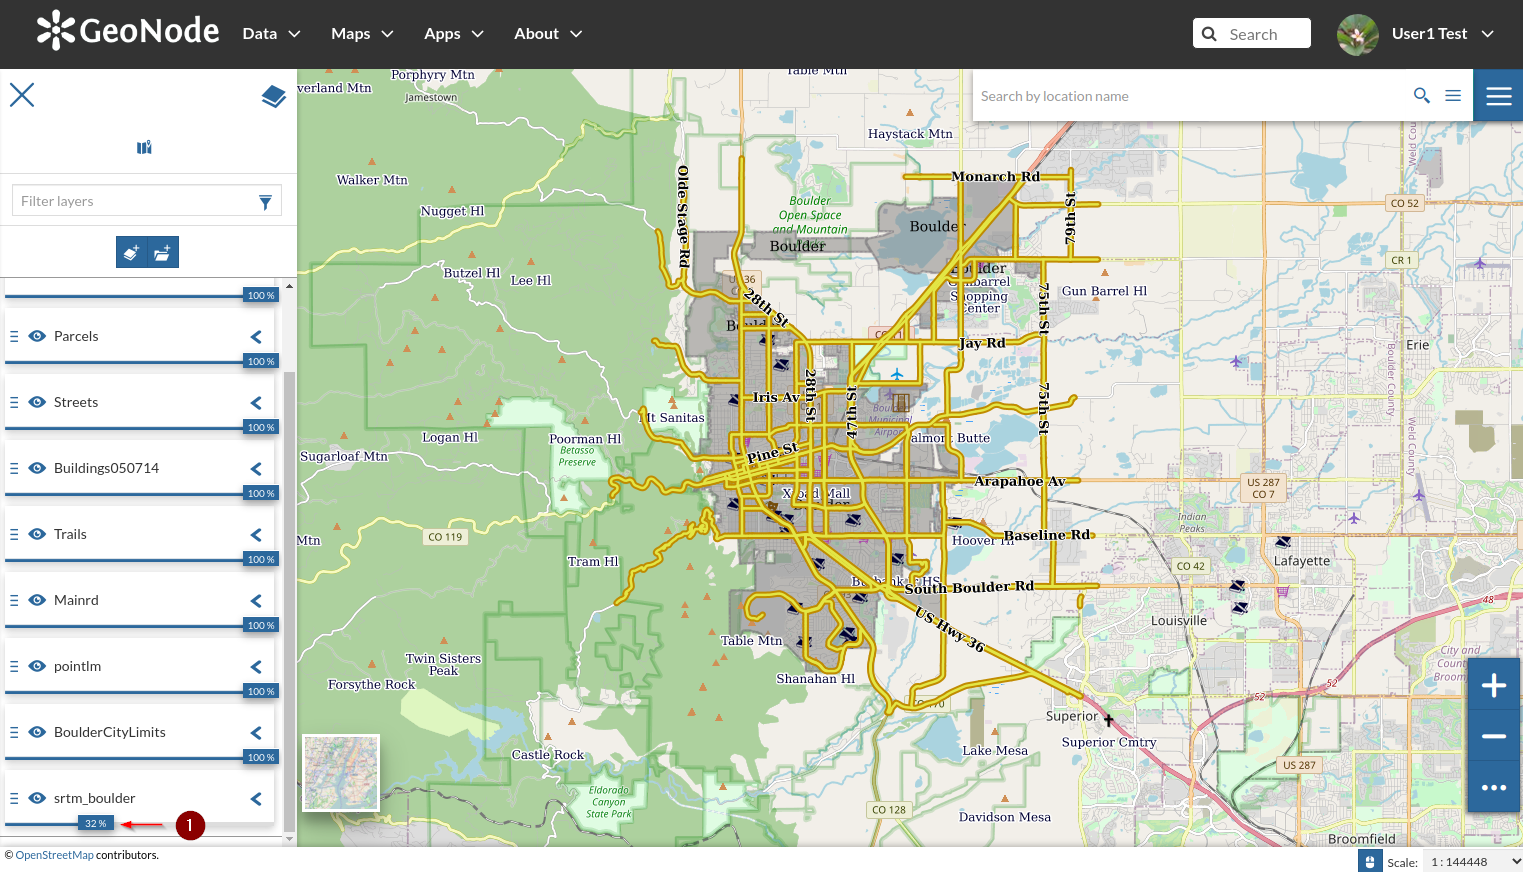
- Change the opacity of the background layer as shown in the figure below. Zoom in and out in order to show/hide the layer details
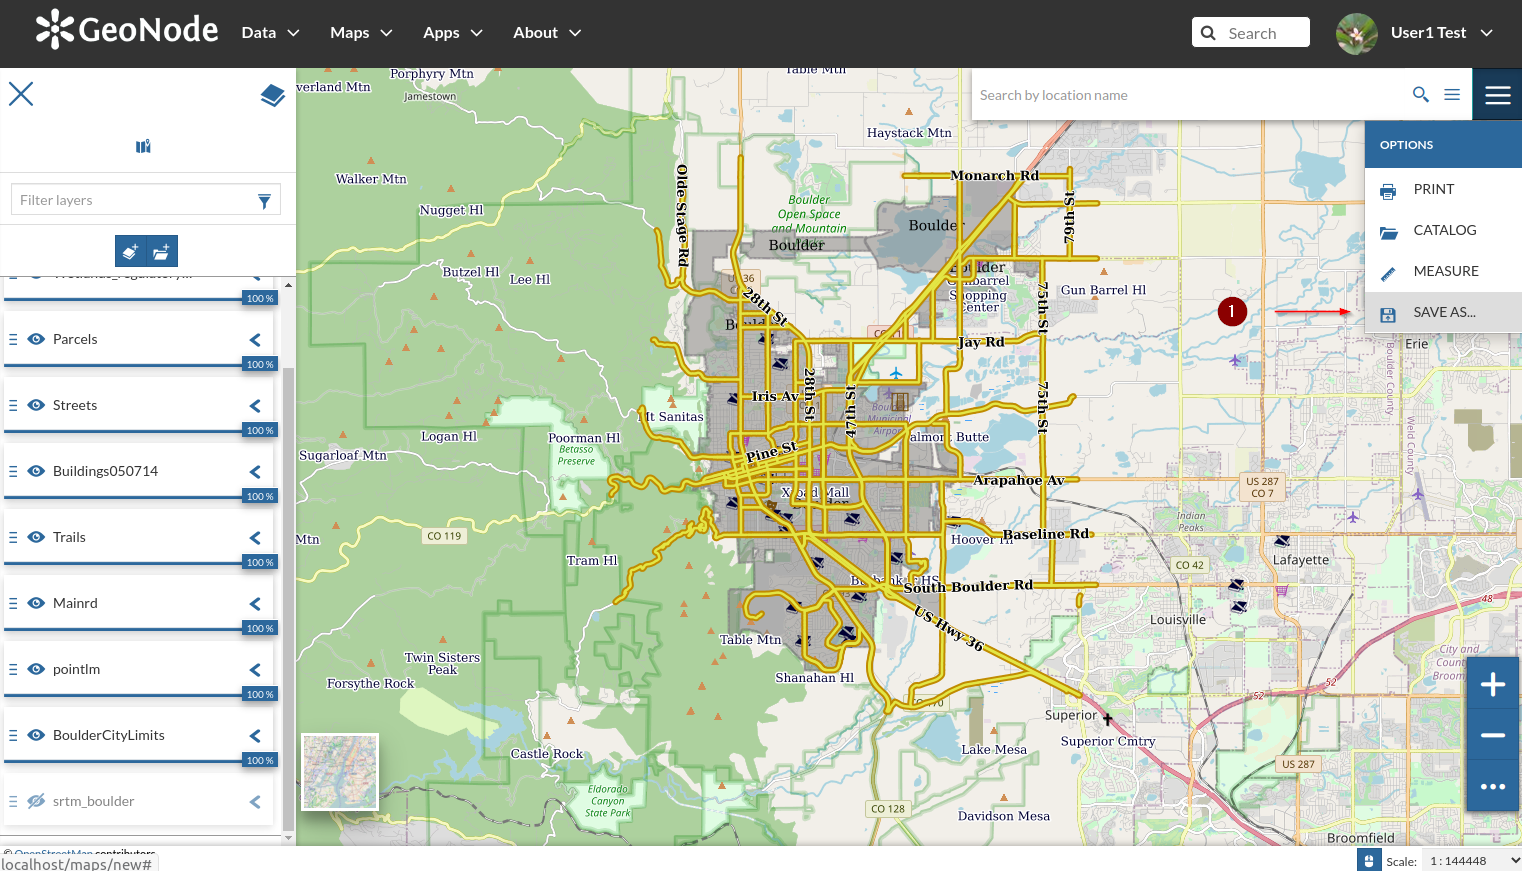
- Once happy, click on the `top-right burger` menu and select `Save As` from the dropdown list
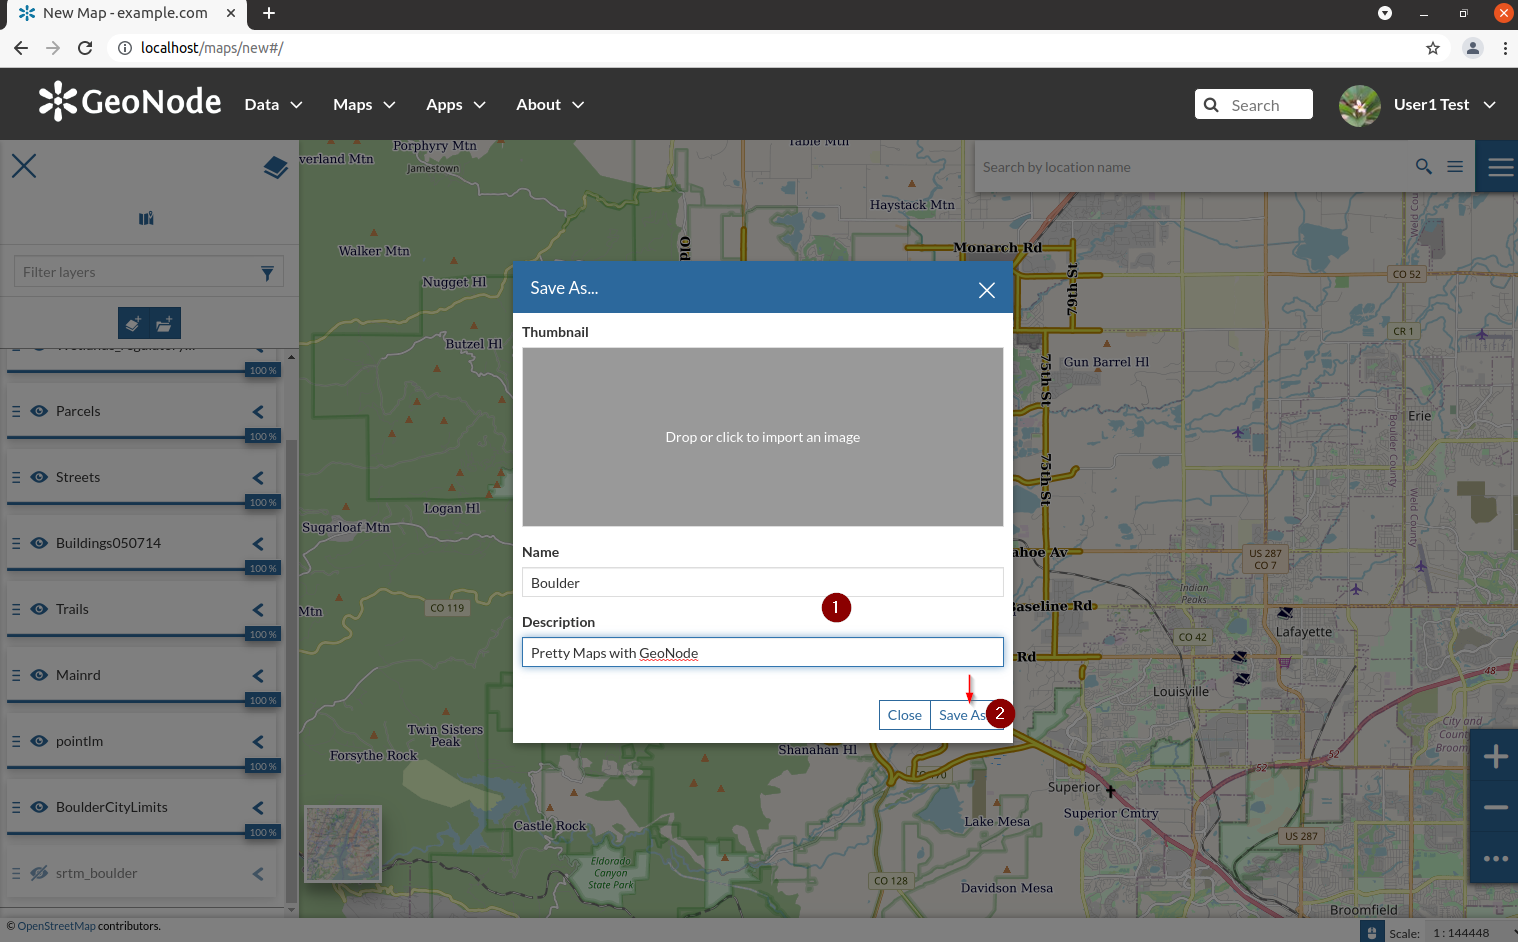
- Provide a name and a description and then click on `Save As` button
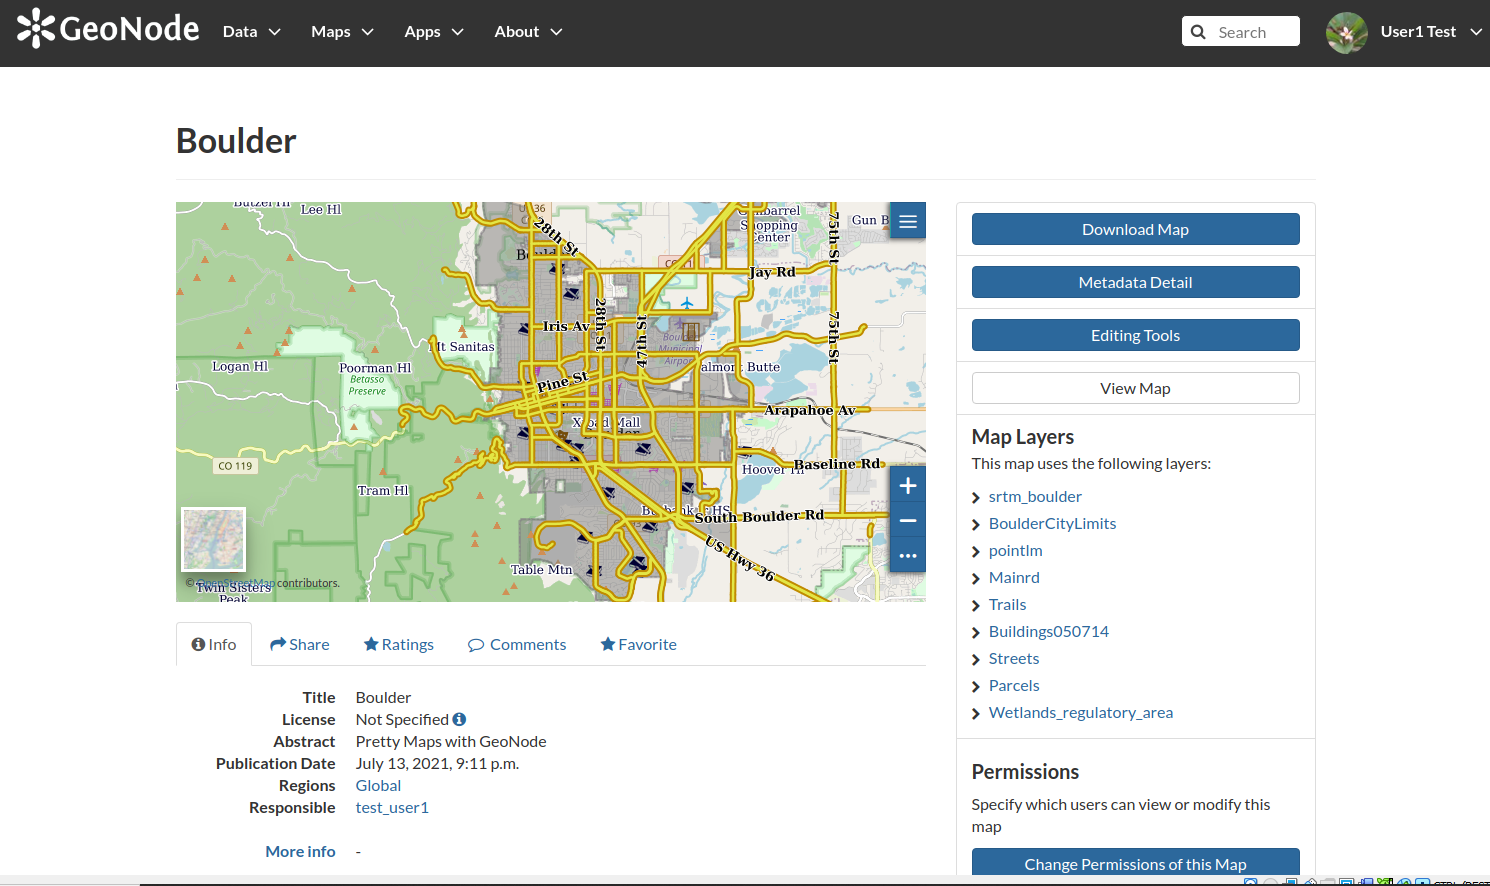
- If the machine is particularly slow, the save action might display a `timeout error`; you can ignore it and go to the `maps list`. Select the newly created map in order to enter the `Map details` page
#### [Next Section: Adding Other Media Types Contents](UPLOADING_DOCS.md)